Snapshots
Snapshots compares the point-in-time values captured by configured snapshot events. It turns array parameters from many occurrences into charts and statistical tables, helping you see distributions and emerging trends across the fleet.
Open Analytic tools > Snapshots in the left navigation.
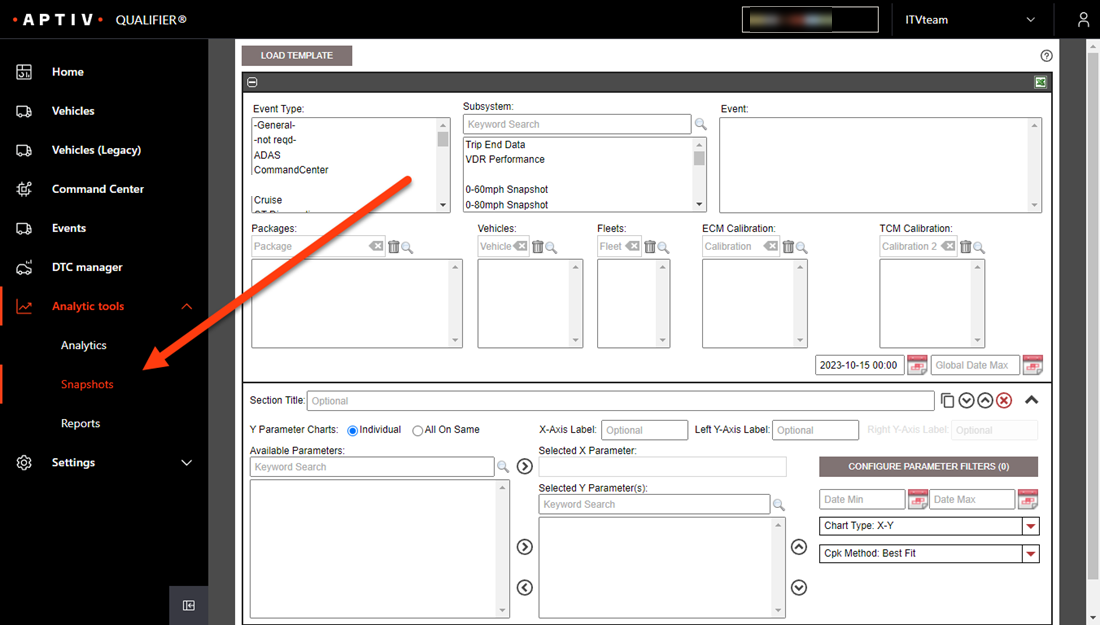
The page opens with a New Snapshot Analysis card and, below it, the analyses you have already saved as templates, listed with their subsystem, type, creator, and last update.
Building an analysis
1. Pick your events and set global filters
Choose the events to pull data from. You can select more than one, but they all have to come from the same subsystem.
Then set your global filters. They are called global because they apply to the whole analysis, as opposed to the filters you can set inside an individual section.
2. Add sections
A snapshot analysis is built from sections, and it can have one or many.
Add a new section whenever you want to change the x parameter, change the grouping, or apply a different filter to a graph. Sections are also just a good way to label and organize a long analysis.
Working with the results
Once the analysis runs you can:
- Export the charts and the tables
- Adjust chart settings
- View and edit histograms of the data set
- Set thresholds and choose the method used for Cpk calculations
See Use Plotly graphs in Snapshots for the charting controls, which are not all obvious.
The statistics table
The statistics table reports the number of observations (Obs), the minimum (Min), the maximum (Max), the mean, the standard deviation (σ), and the range for each parameter.
Cpk
For Cpk calculations, Qualifier optimizes the data set to produce the most reliable result. Cpk assumes the data is normally distributed, so Qualifier tests normality using the Anderson-Darling test and applies whichever transformation gives the best Anderson-Darling value.
See Reports for setting package-specific Cpk thresholds.