Reports
Reports runs a defined analysis against the fleet data and filters you select. Use the result online or download it as a file for review and circulation.
Open Analytic tools > Reports in the left navigation.
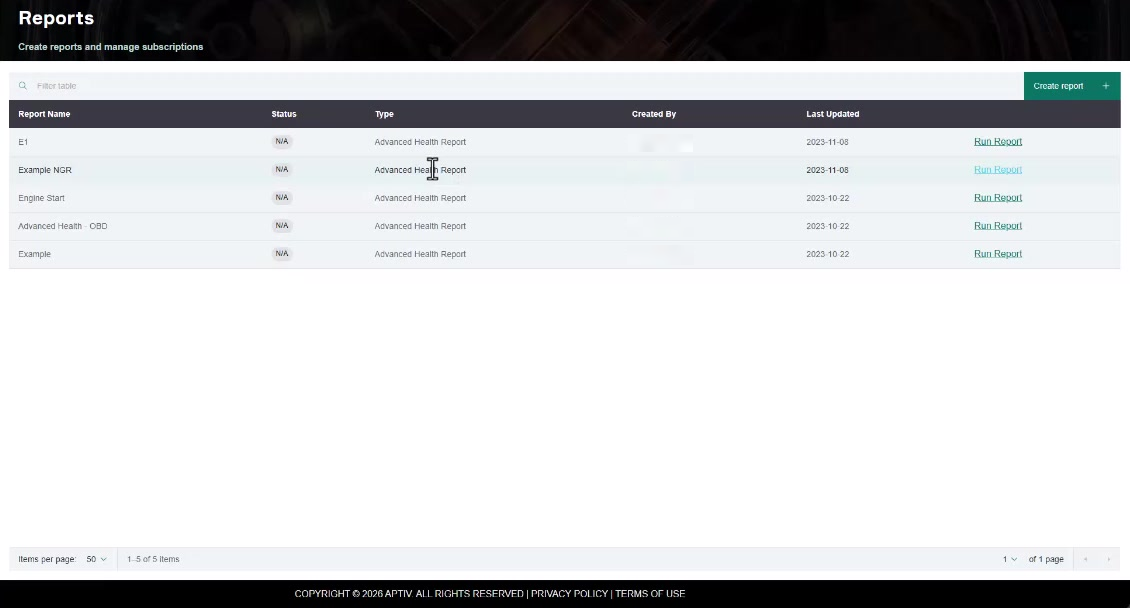
The table lists the reports you have already created, with their status, type, creator, and when they last ran. Click Run Report on any row to run it again.
Use Filter table to search the list.
Creating a report
Click Create report to open the wizard. It has four steps, listed down the left so you can see where you are.
| Step | What you set |
|---|---|
| 1. General Setting | Name the report and choose its type |
| 2. Data Filters | Narrow the data the report runs over |
| 3. Advance Configurations | Optional extra filtering |
| 4. Timing & Recurrence | When the report runs |
Step 1: General Setting
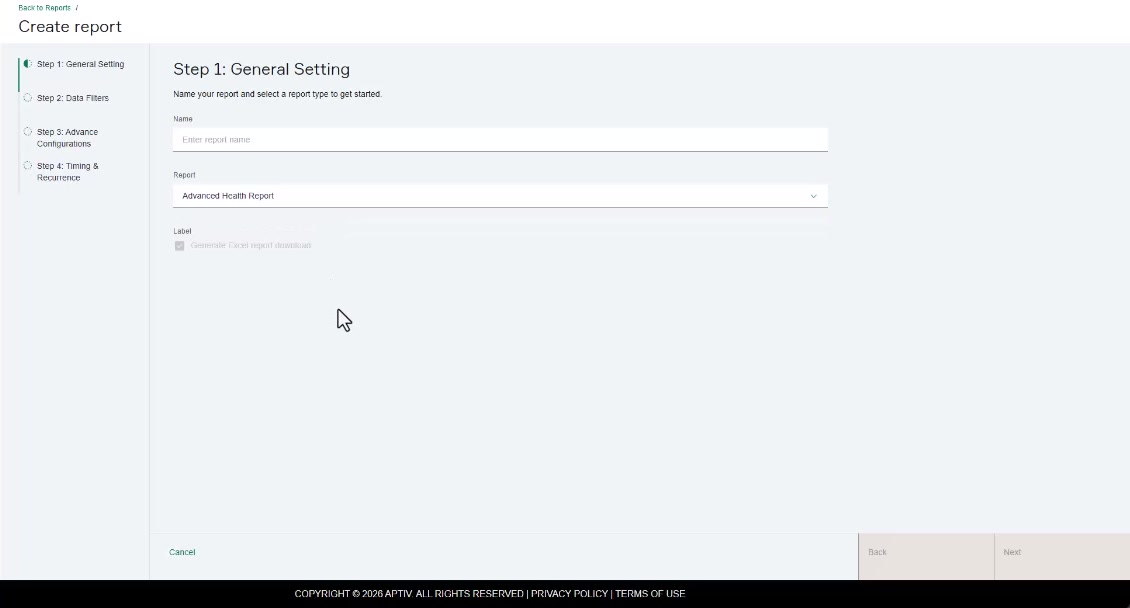
Enter a Name, then choose a Report type. The Advanced Health Report is the type available here.
Step 2: Data Filters
A report cannot run across everything, so this step narrows it down.
Choose a system, meaning the subsystem whose data the report covers. Then narrow further by fleet, date range, and module family. You can also select specific vehicles and packages.
Step 3: Advance Configurations
Optional. Narrow by model year or by assignee, the person a diagnostic trouble code (DTC) or event was assigned to, so the report only covers issues owned by particular people. You can also exclude particular DTC states.
Step 4: Timing & Recurrence
Sets when the report runs.
Submit
Click submit to run the report. It appears in the table on the Reports page, and you download the output from there.
Recurring reports that run on a schedule and email their output to a list of recipients are set up in the legacy interface. See Legacy Qualifier.
Report types
Reports fall into four families. Which ones your organization uses depends on what was set up with your Aptiv customer support engineer (CSE).
| Family | What it is for |
|---|---|
| Status | Tracking a fleet and monitoring issues. Covers vehicle usage and a statistical analysis of issues, summarizing how a program is performing. The Advanced Health Report belongs here |
| Scorecard | Quality metrics. Statistical information for a subsystem's data, usually VIN by VIN, though some offer group statistics |
| Snapshot | Subsystem robustness in detail. Scatter plots and statistics much like the Snapshots page, or histogram data |
| Health | Everything about one subsystem in a single document. Events and DTCs first, then robustness with scatter plots, histograms, and statistical analysis |
Cpk
Cpk is one of several metrics Qualifier uses to judge robustness. It measures the separation between a subsystem metric and its threshold, which is what makes it useful for saying whether a diagnostic is comfortably within limits or sitting on the edge of them.
Cpk assumes the data is normally distributed. Qualifier tests that assumption using the Anderson-Darling normality test, and where the data is not normal it applies whichever transformation produces the best Anderson-Darling value. The result is the most reliable Cpk the data supports.
Package-specific Cpk thresholds
A single threshold across every package is often too blunt. Package-specific thresholds let each package and parameter combination carry its own, and you can save them for reuse.
They are available in any report containing snapshot data, and apply when you group by package, vehicle, or calibration.
-
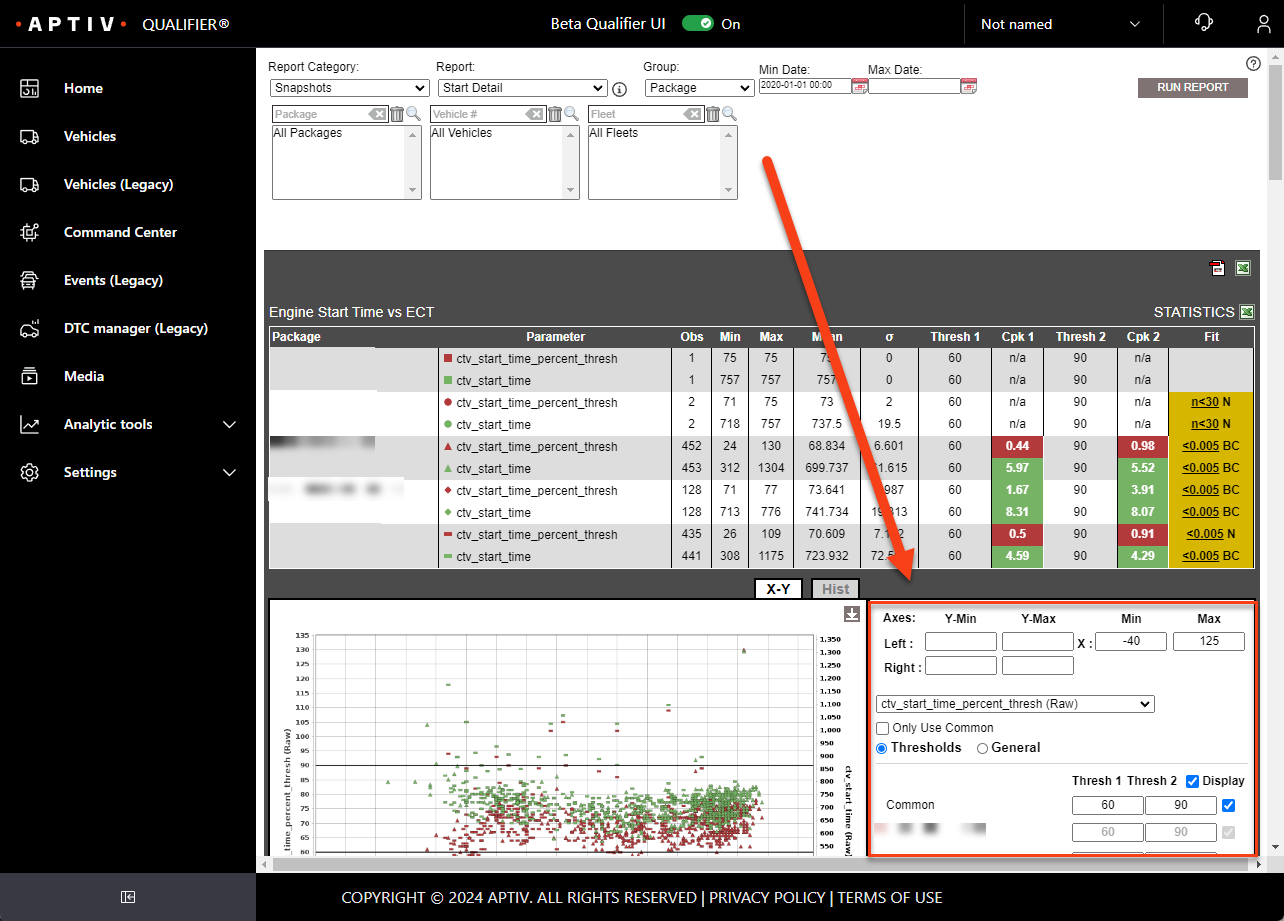
Open the Chart Options menu below the graph you are interested in. The axes controls live in the same menu.
-
Find the threshold controls. Each package is listed with its threshold beside it, plus one labeled common.
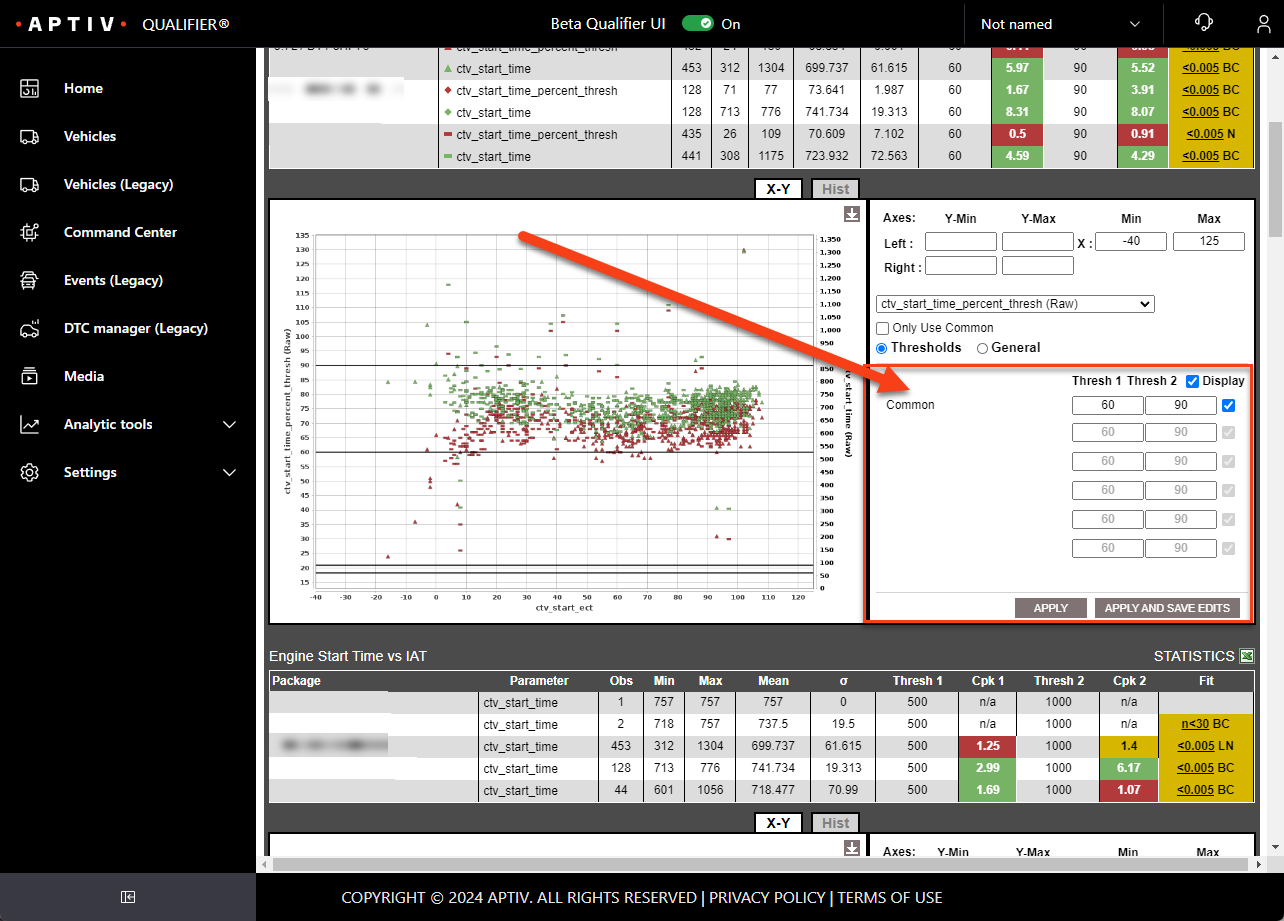
Common applies to any package without its own threshold. A common threshold shows in grey against every package that inherits it.
If nothing has been set, including common, every field is blank and the statistics table shows no Cpk.
-
Type a new threshold against a package, choose whether to draw the line on the graph, and click Apply.
The graph and the Cpk in the statistics table update for that package.
If your access level allows it, Apply and Save Edits keeps the threshold for future runs. Be careful with it: saved thresholds apply to that package and parameter combination for everyone who uses the report.