DTC Manager
DTC Manager brings diagnostic trouble codes (DTCs) from across the fleet into one investigation view. Use it to identify recurring codes, compare affected vehicles and packages, and open the recording behind an individual occurrence.
Aptiv vehicle data recorders (VDRs) capture a DTC event whenever they detect a new code. The result is an event file, the same kind of datalog produced by any other event, typically 60 seconds of pre-trigger data and 10 seconds after, though that window is configurable.
Like Events, the page groups repeated occurrences so patterns are visible without working through a separate file for every vehicle.
Qualifier applies a date filter as soon as this page opens, covering roughly the last two weeks. The exact range depends on your organization.
If the page looks emptier than you expected, this is almost always why. Widen Min Date rather than assuming the data is missing. See Set the date range.
Keep some date filter on wherever you can. These tables build up a lot of history, and removing the filter entirely to see everything at once makes the page slow and hard to work with.
The DTC table
Click DTC Manager in the left navigation.
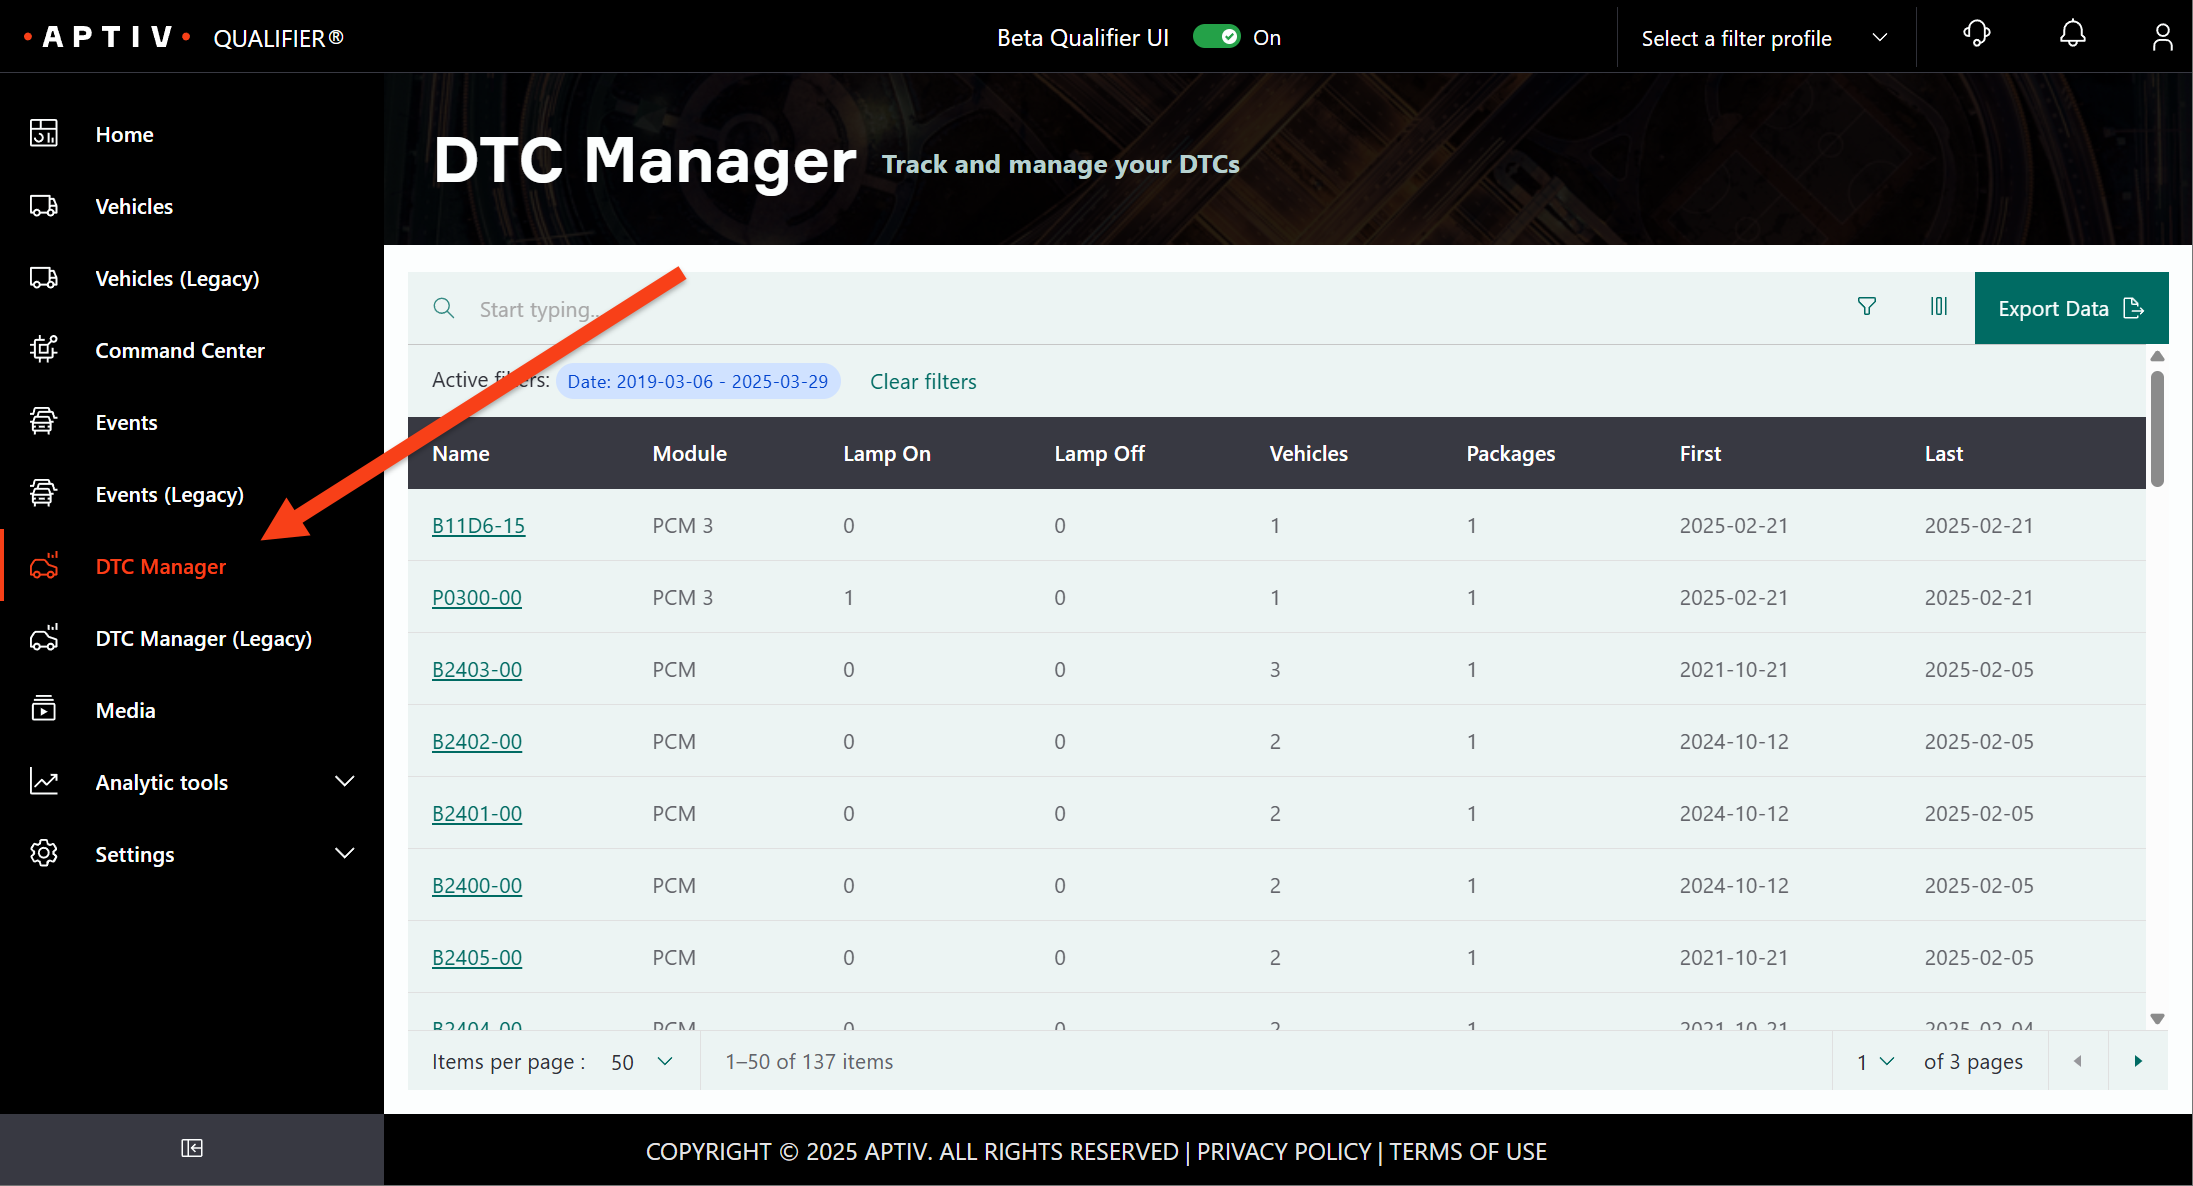
Each row is a DTC, with the module that set it, lamp on and lamp off counts, how many vehicles and packages show it, and the first and last dates.
Export Data at the top right downloads the table as a CSV file.
Filtering
Two ways, as elsewhere.
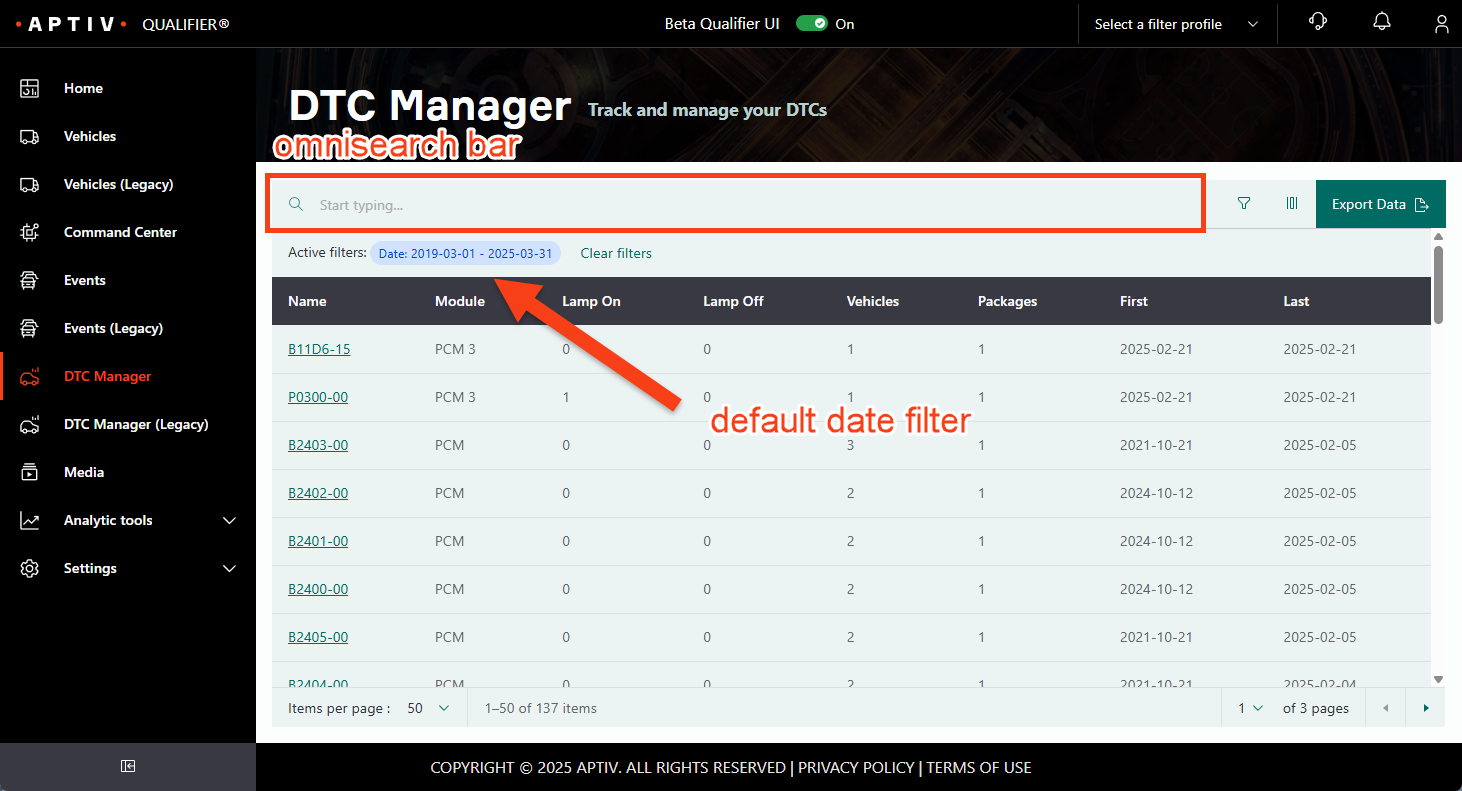
Omnisearch. Type a name or code and the table narrows as you type.
The filter icon. Opens a panel offering Min Date, Max Date, DTC Status, DTC Type, Status Bits, Occurrence Status, Vehicle, Fleet, and Package. Click Apply.
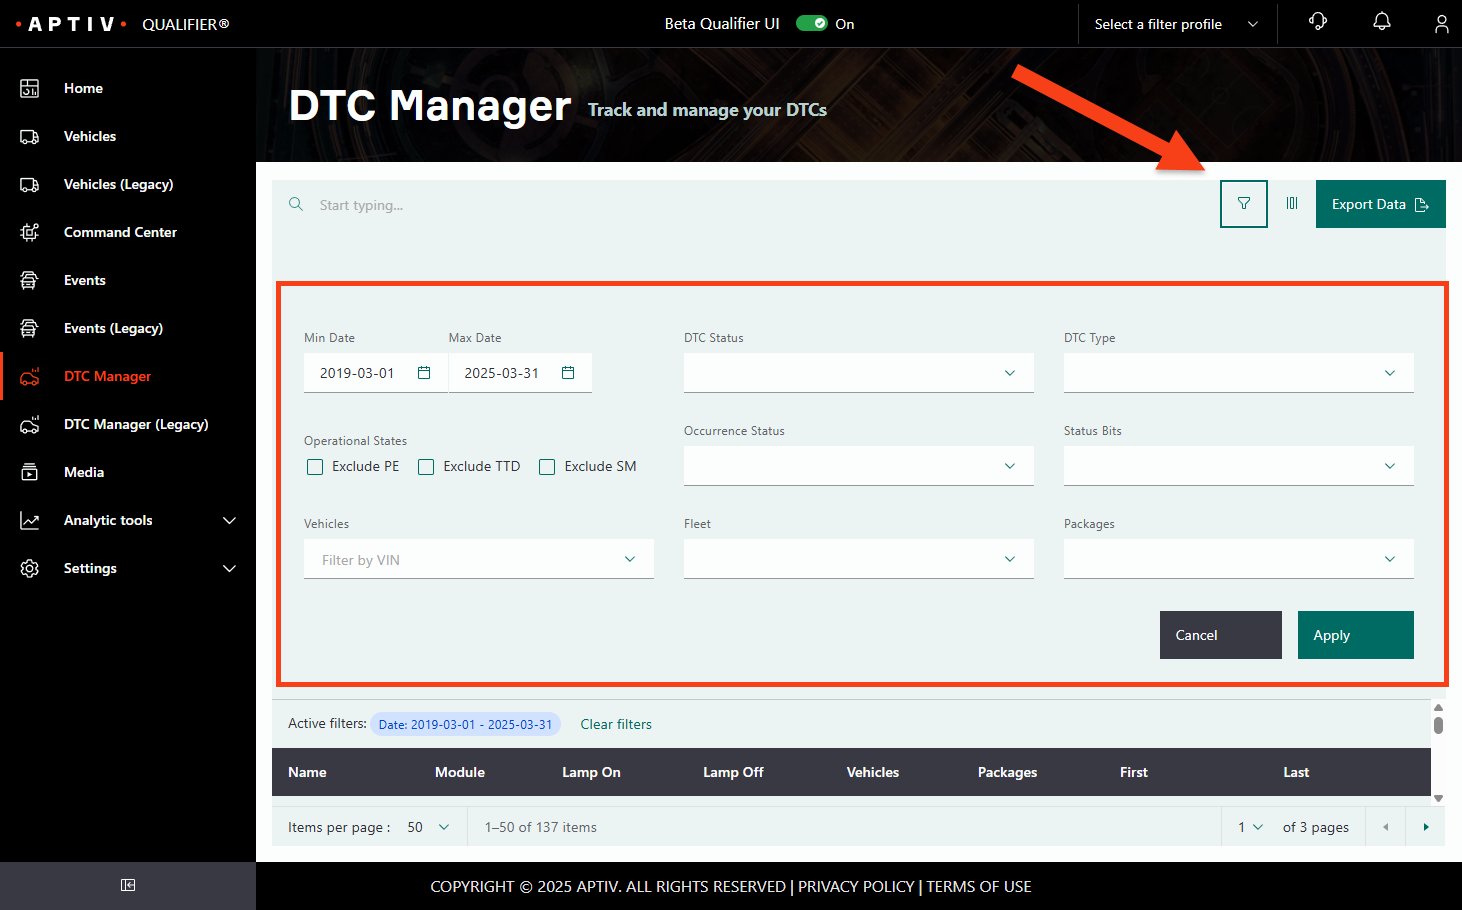
Active filters appear as chips below the search bar, and Clear Filters removes them all.
DTC types and lifecycle states
A DTC type describes the code's current lifecycle state: whether it is requesting the malfunction indicator light (MIL), has been detected but not confirmed, was seen previously, or has since cleared. Filtering on this value separates current faults from historical records.
You can filter by DTC Type from the filter panel on any DTC page: the main DTC Manager table and the Packages, Vehicles, and Overview tabs of a code's detailed view.
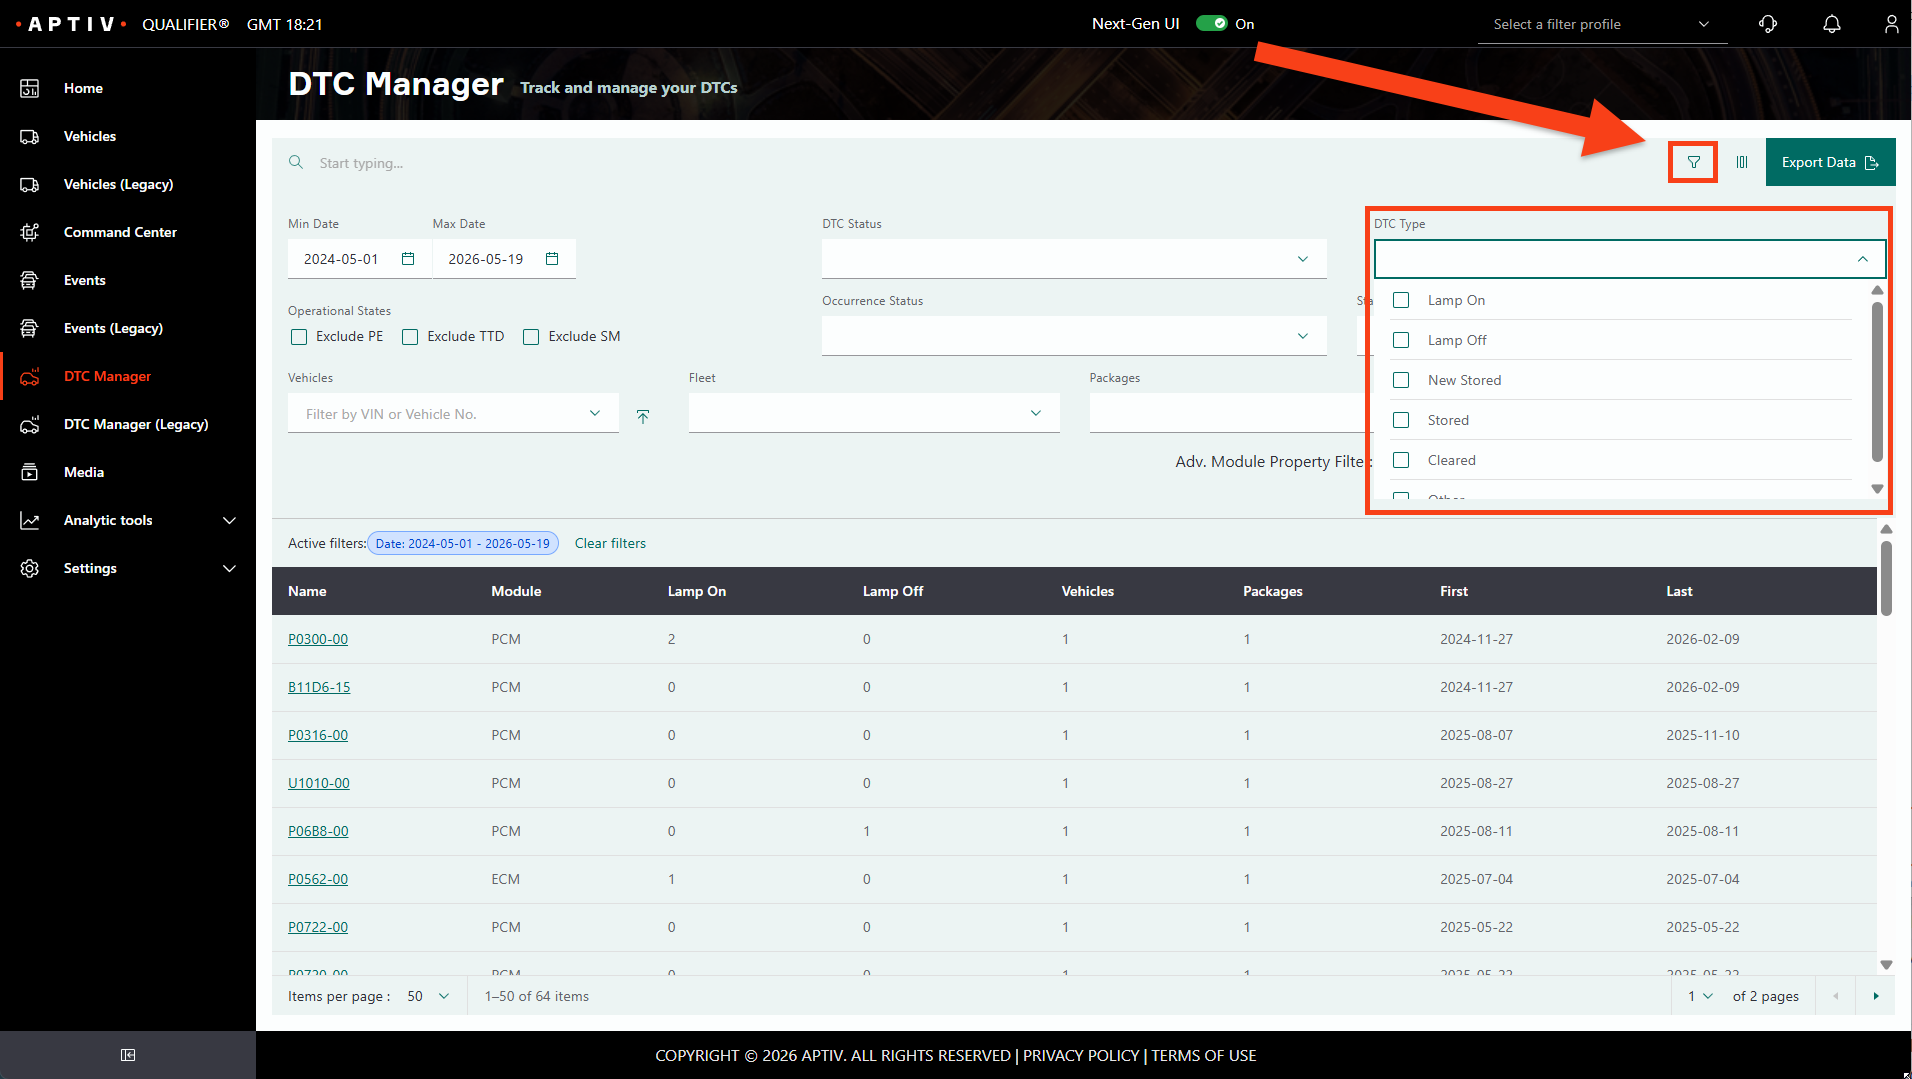
The types
| Type | Meaning |
|---|---|
| Lamp On | The DTC is confirmed and MIL activation has been requested |
| Lamp Off | The diagnostic failed during the drive cycle. If it fails again on the next drive cycle it either gets confirmed and sets the MIL, or stays confirmed without the MIL in the case of a non-MIL DTC |
| New Stored | The first time this DTC has been observed with a status of Stored |
| Stored | A previously detected DTC that is no longer active this drive cycle |
| Cleared | A previously detected DTC that is no longer present |
| Other | The status does not fit any of the categories above |
Opening a DTC
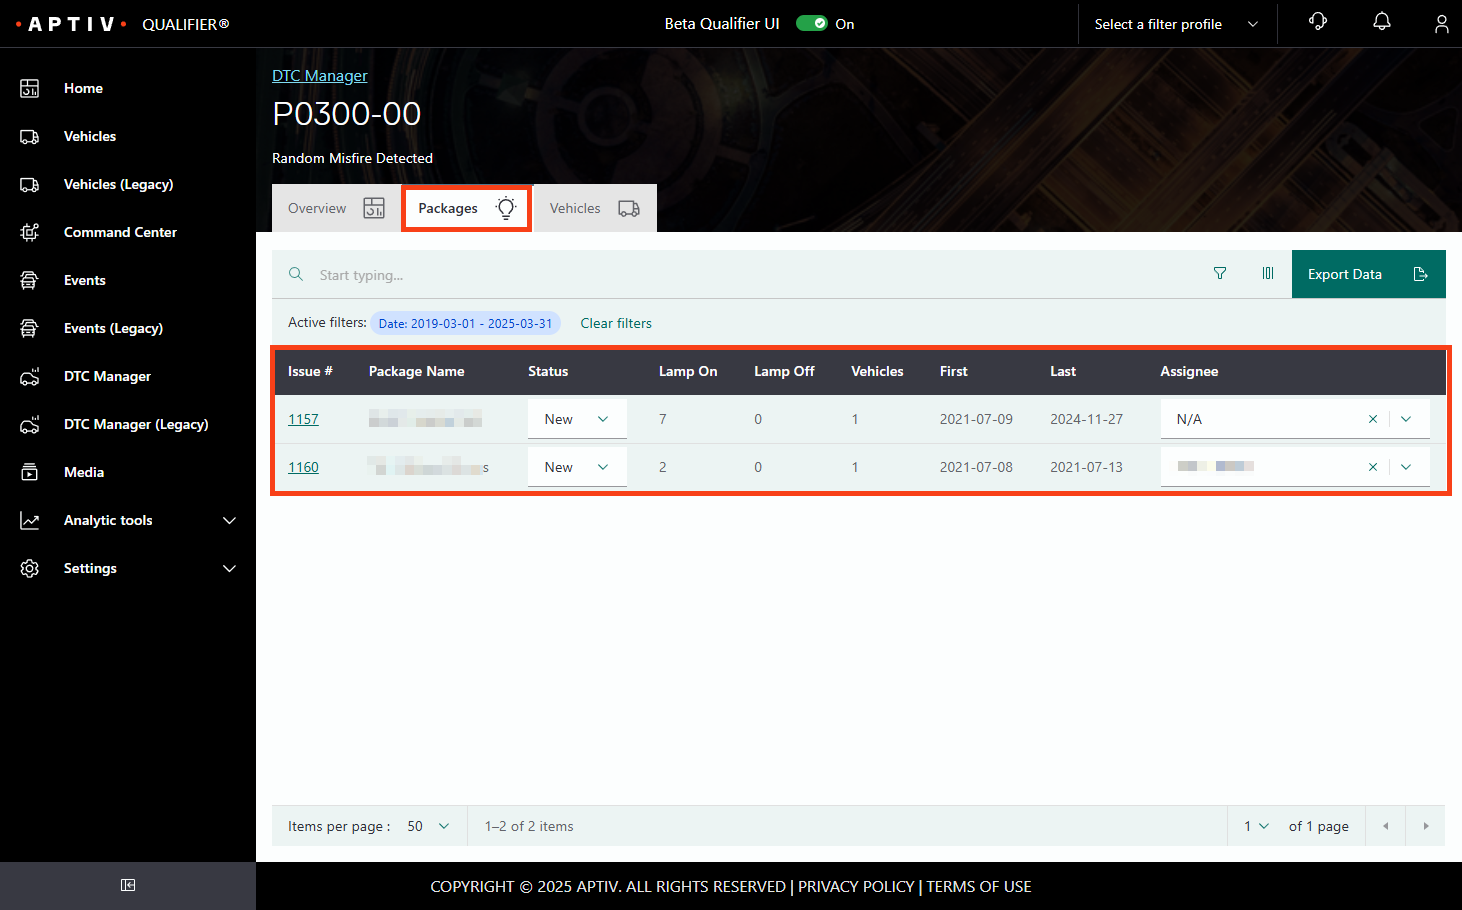
Click a code to open it. It opens on the Packages tab, and offers three tabs.
Packages tab
Groups the code's issues by vehicle package.
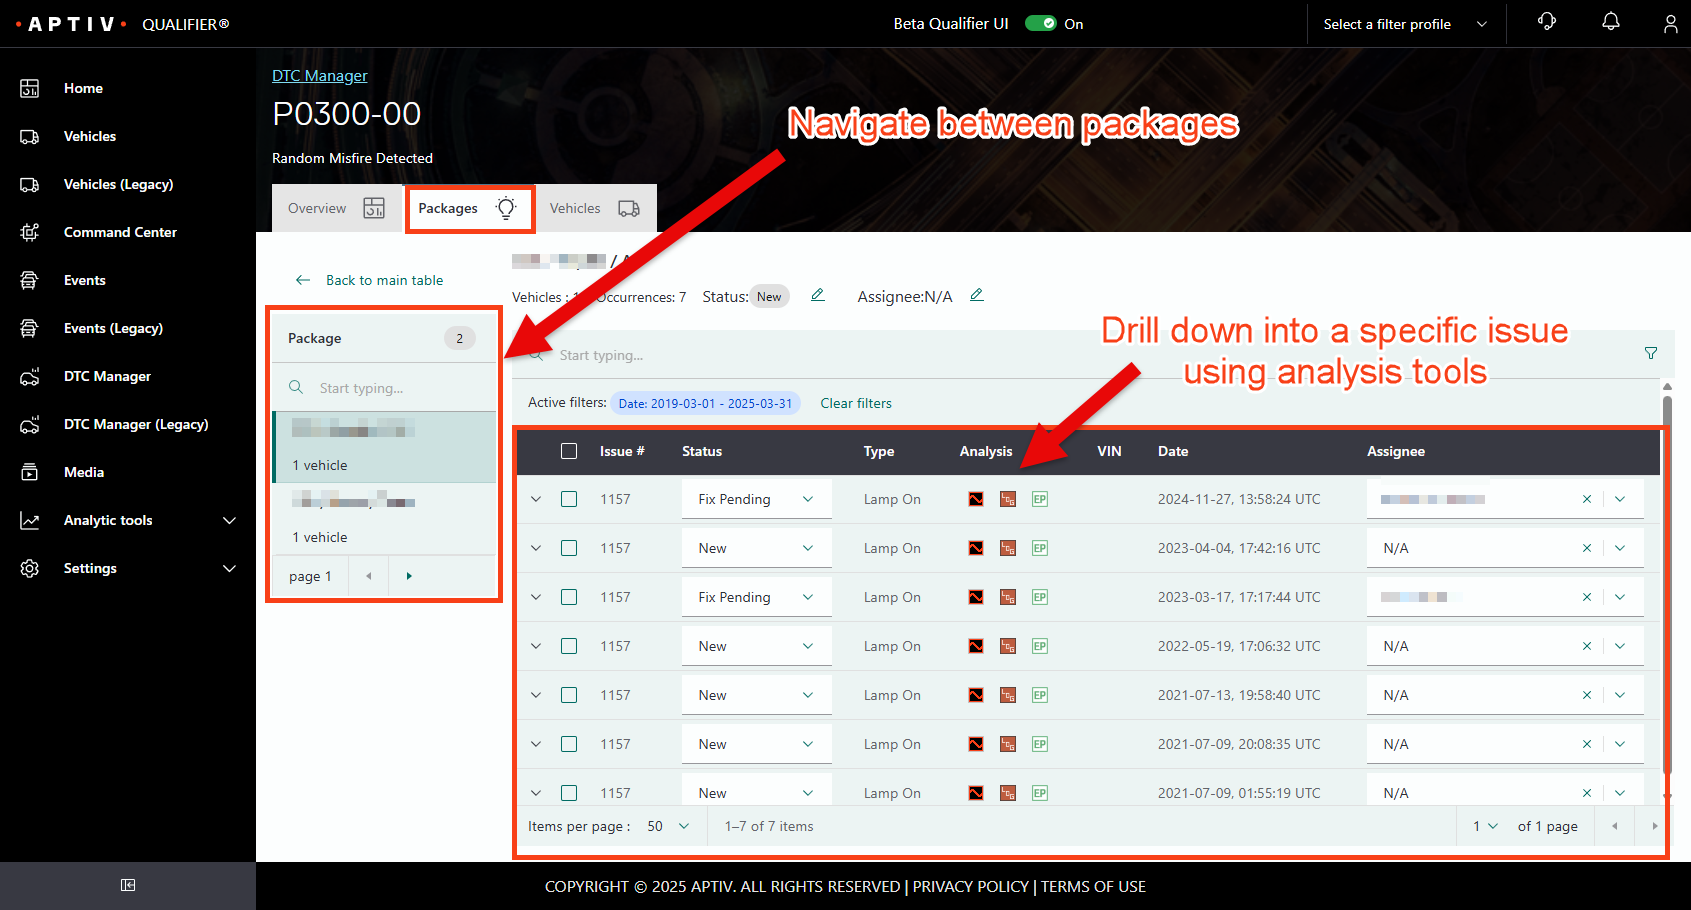
Click an issue to open the issue-level view, where you can see its status, type, VIN, date, and assignee, and move between packages using the left column.
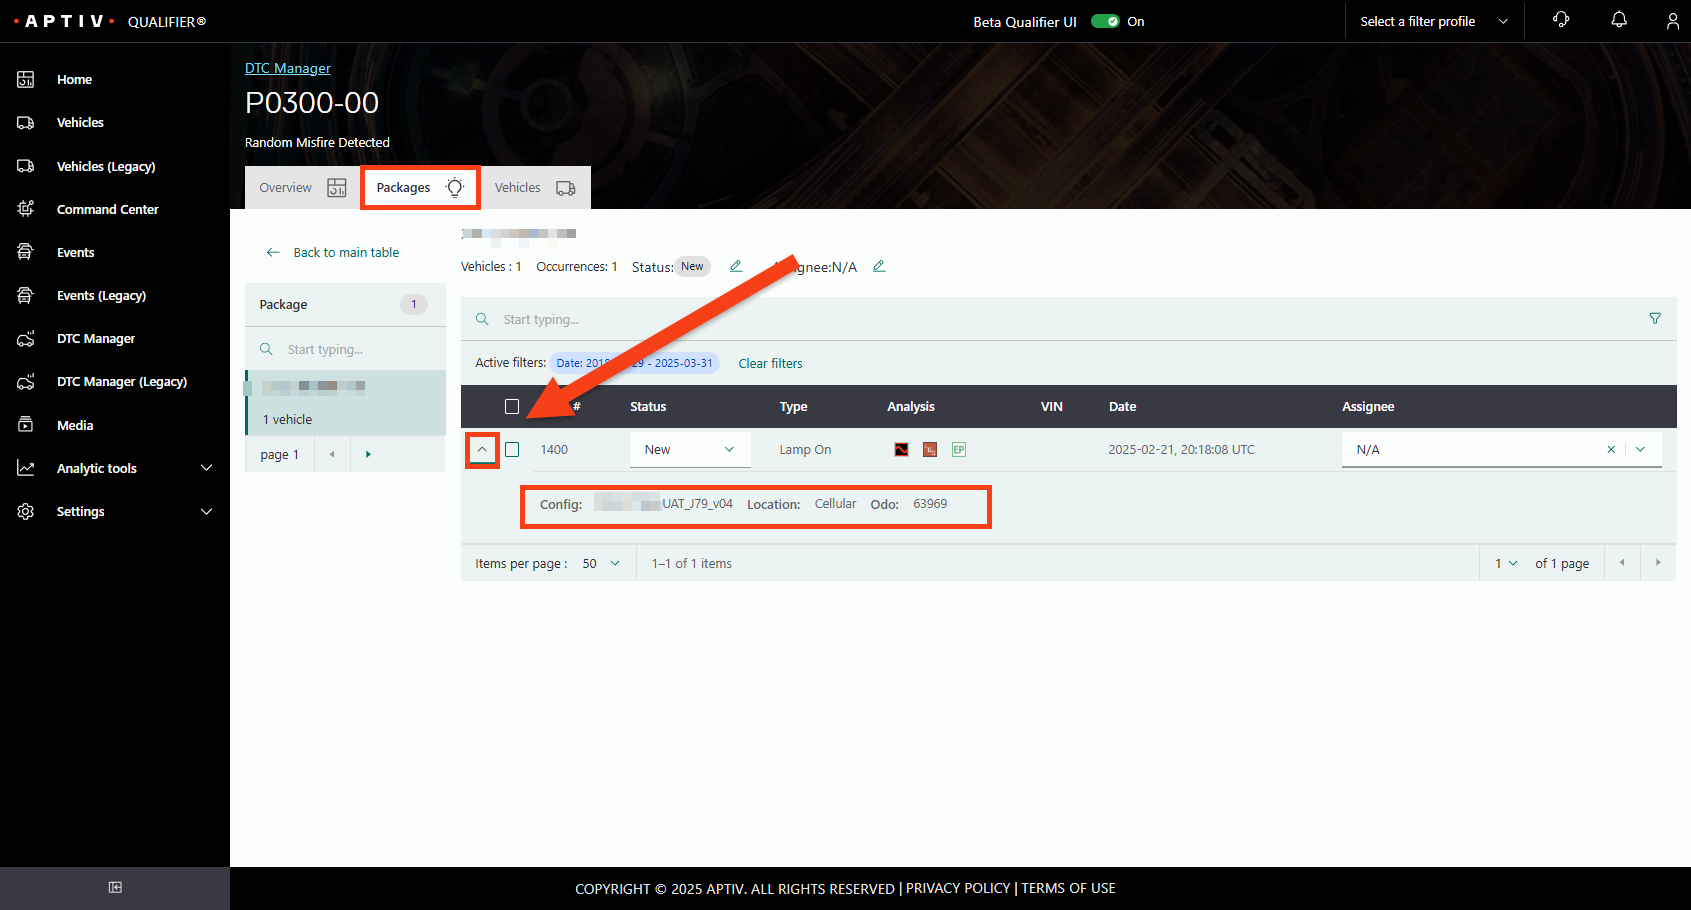
Click the arrow beside an issue for more detail, including the config, the location, and the odometer reading when the DTC was set.
The analysis icons on each row do the following:
| Icon | What it does |
|---|---|
| AC-Graph | Graphs the event data in AC-Graph |
| Trip summary | Opens the trip summary log in a new browser window |
| Download | Downloads environmental parameters or freeze-frame data as a TXT file |
Vehicles tab
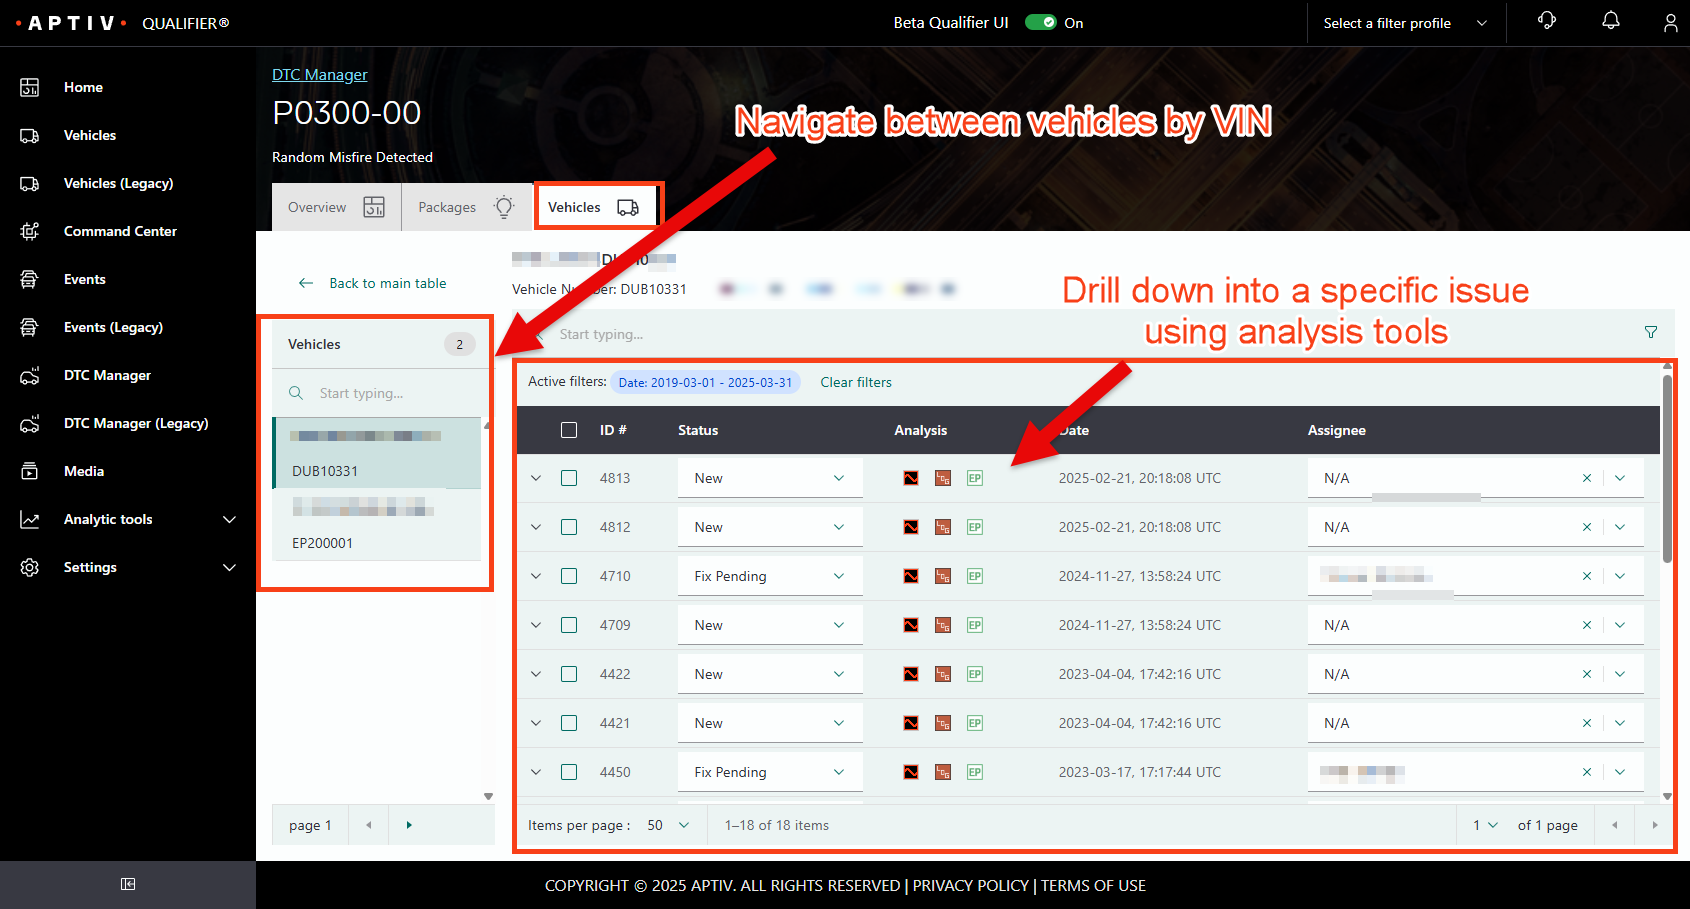
Summarizes occurrences by VIN, with packages, fleets, lamp counts, and the first and last dates.
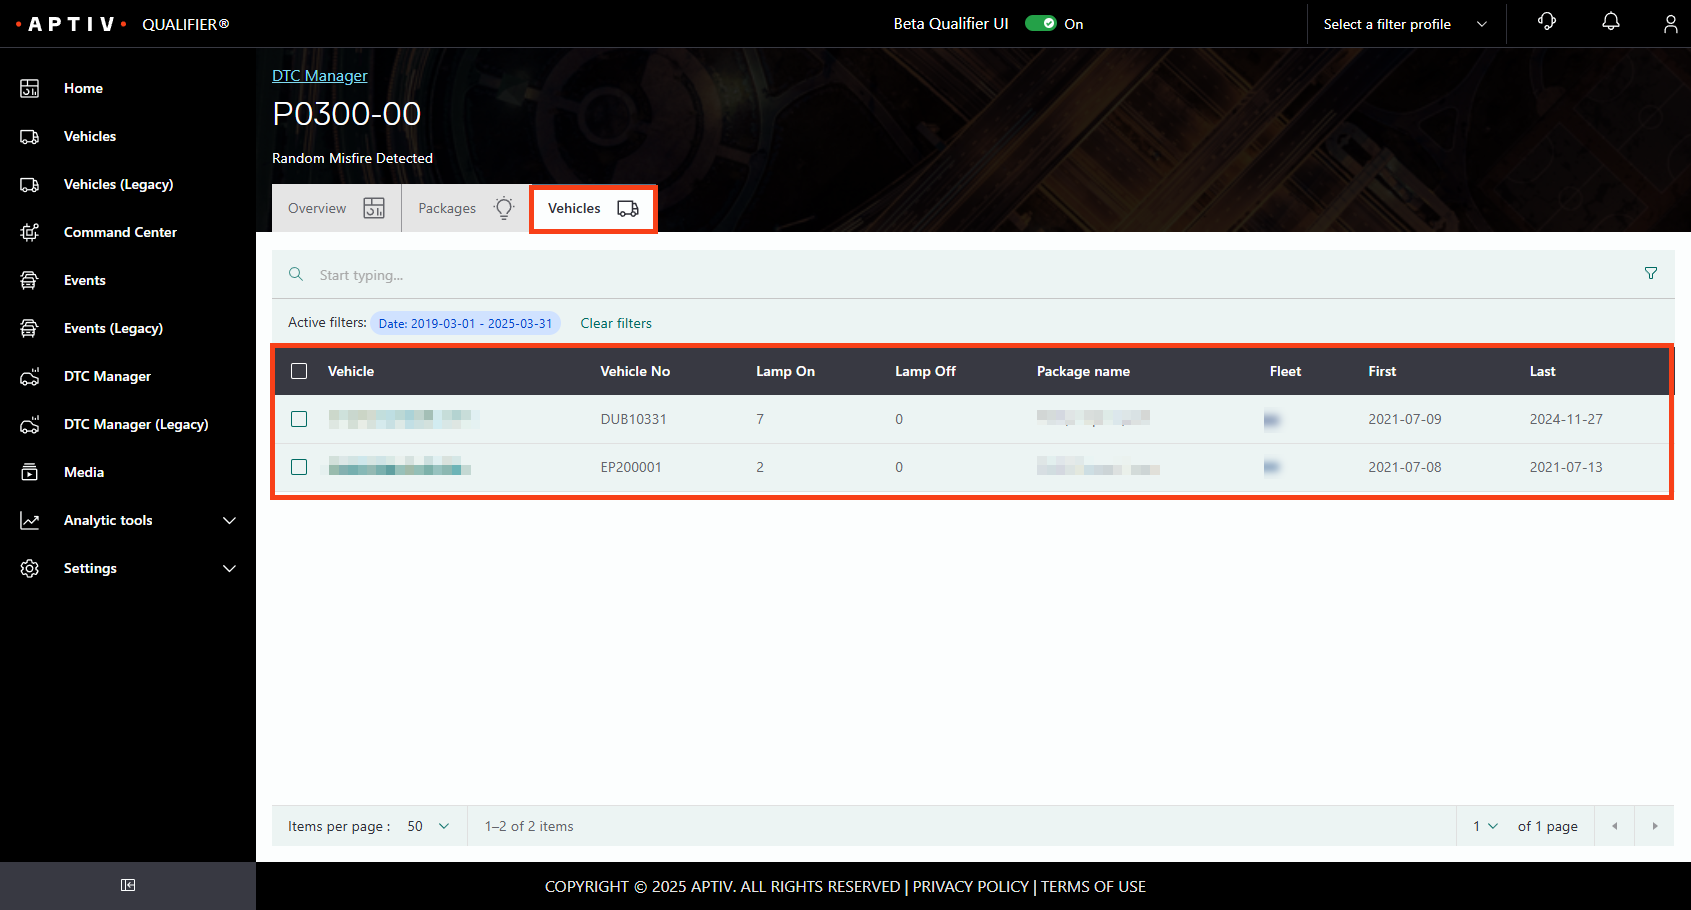
Click a VIN to open the vehicle-level view, where you can see status, ID number, date, and assignee, and move between VINs using the left column.
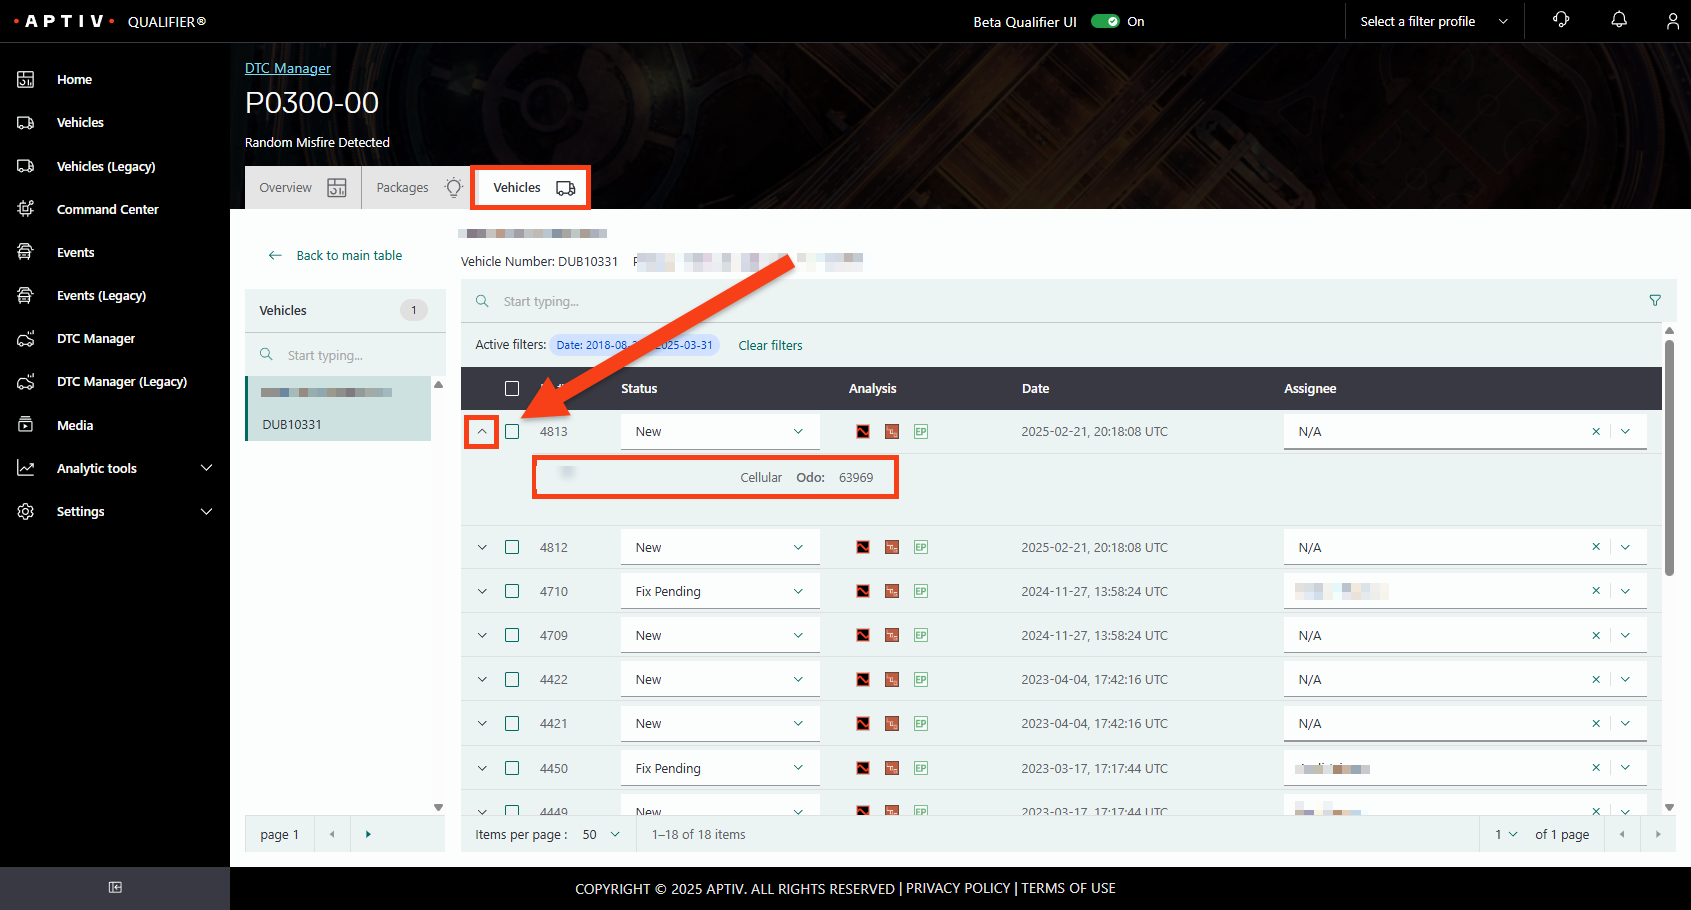
Click the arrow beside an ID number for the config, location, and odometer reading.
The same analysis icons appear here.
Overview tab
Summarizes lamp on and lamp off occurrences and the number of packages and vehicles affected, then charts lamp on and off occurrences by package. Hover a bar for its detail.
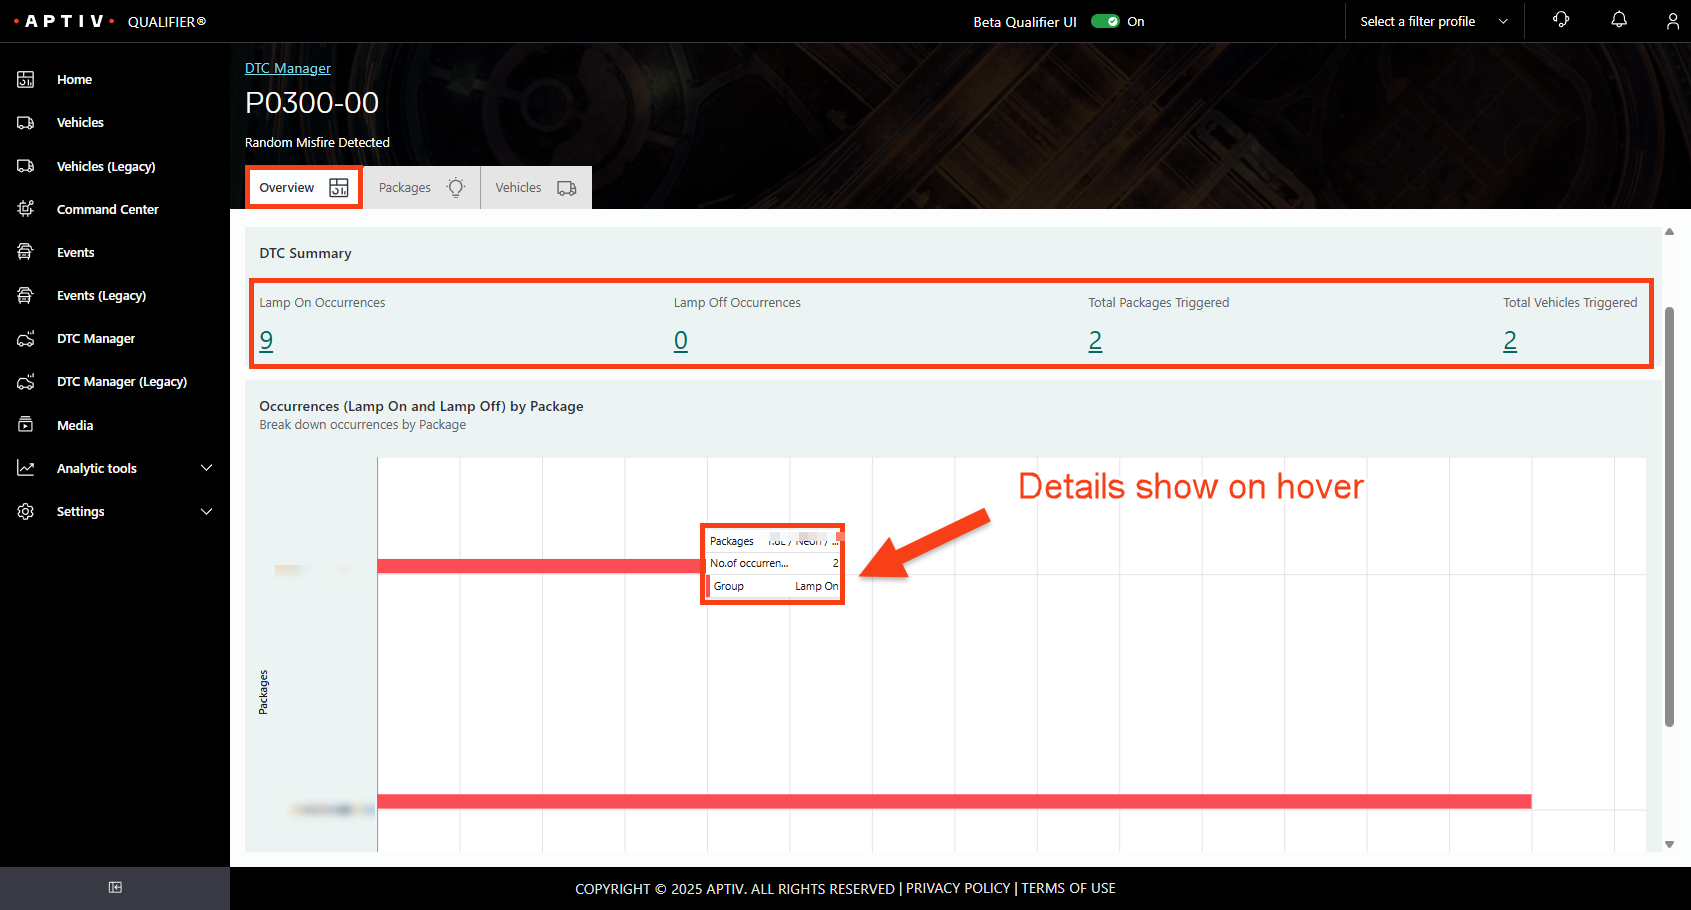
Use the filter icon at the top right of the tab to narrow what the chart covers.