Command Center
Command Center provides a near-real-time view of vehicles whose vehicle data recorders (VDRs) are online. It combines their current positions, health information, events, diagnostic trouble codes (DTCs), and selected live signals on a map and dashboard.
Command Center is an optional part of Qualifier. If you do not see it in the left navigation, your organization has not enabled it.
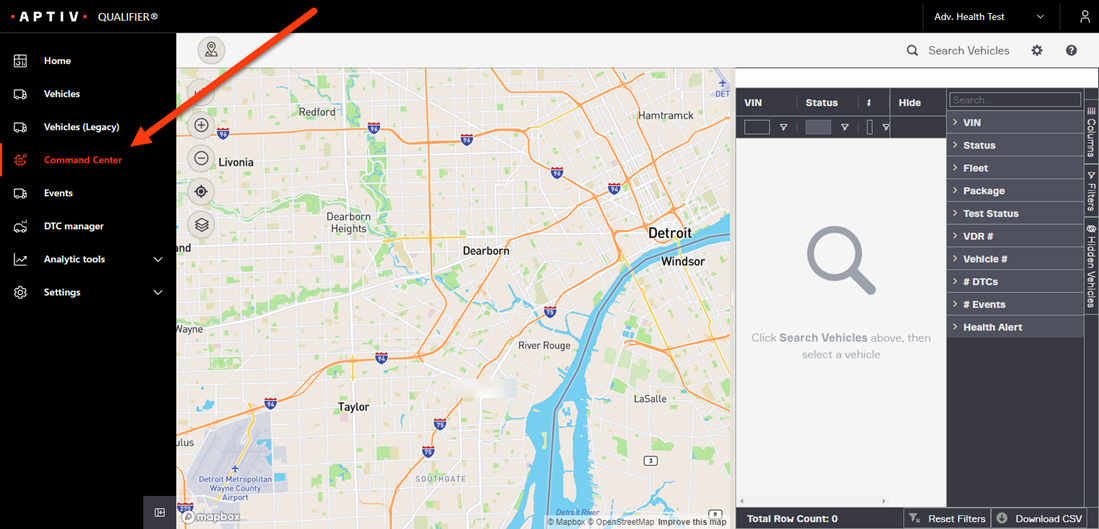
Finding vehicles to watch
The map begins empty so you can choose a focused group of vehicles to monitor.
-
Click Search Vehicles at the top right.
-
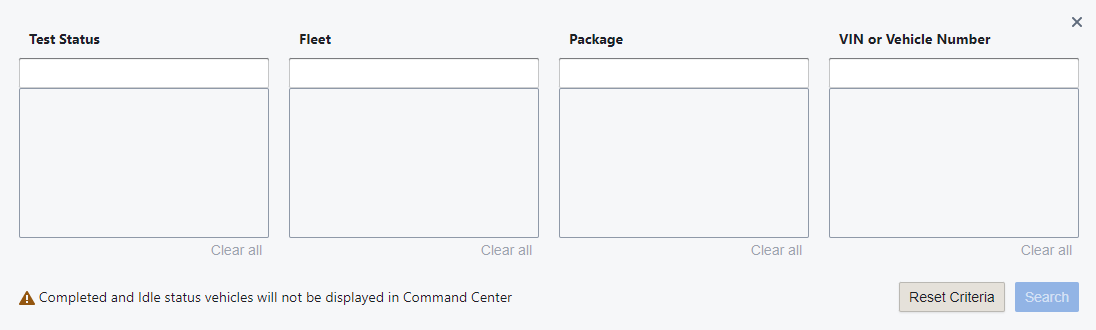
Enter your criteria. You can search by test status, fleet, package, and vehicle identification number (VIN) or vehicle number.
Typing the first four characters of a VIN brings up a list of matches. If you keep VINs in a spreadsheet you can paste a whole column straight into the VIN box.
Click Add Selected after each criterion.
-
Click Search.
Keep it to 50 vehicles or fewer at a time. Beyond that the map and the updates get slow.
Watching them
Command Center lists the vehicles it found with their status and current DTC count, and plots them on the map, updating as they move.
Click Columns on the right edge to change what the list shows.
Reading the colors
Green means the vehicle is running and has not had a recent DTC or monitored event.
Orange means it has. Vehicles with DTCs jump to the top of the list.
Hover a vehicle for its status and DTC count. Click it, on the map or in the list, to open its dashboard.
Click the eye icon in the Hide column to take a vehicle off the map. The Hidden Vehicles tab on the right edge lists what you have hidden, and the Filters tab shows what is currently applied.
The dashboard panel
Clicking a vehicle opens a panel with five tabs.
| Tab | What it shows |
|---|---|
| Dashboard | Charts of selected signals coming off the vehicle |
| Dynamic Signals | The same signals as a table |
| Events | Preconfigured events this vehicle has had |
| DTCs | Diagnostic trouble codes this vehicle has had |
| Vehicle Properties | Make, model, engine, software version, and so on |
Choosing a dashboard
The dashboard name sits at the top right of the panel. Click it to open a menu.
- Type in Filter to search for a dashboard
- Click a name to open it
- Click Add New Dashboard to build one from scratch
- Click the pencil icon to edit one, saving over the original
- Click the copy icon to duplicate one under a new name
- Click the trash icon to delete one
Building one
Adding or editing opens the Edit Dashboard dialog.
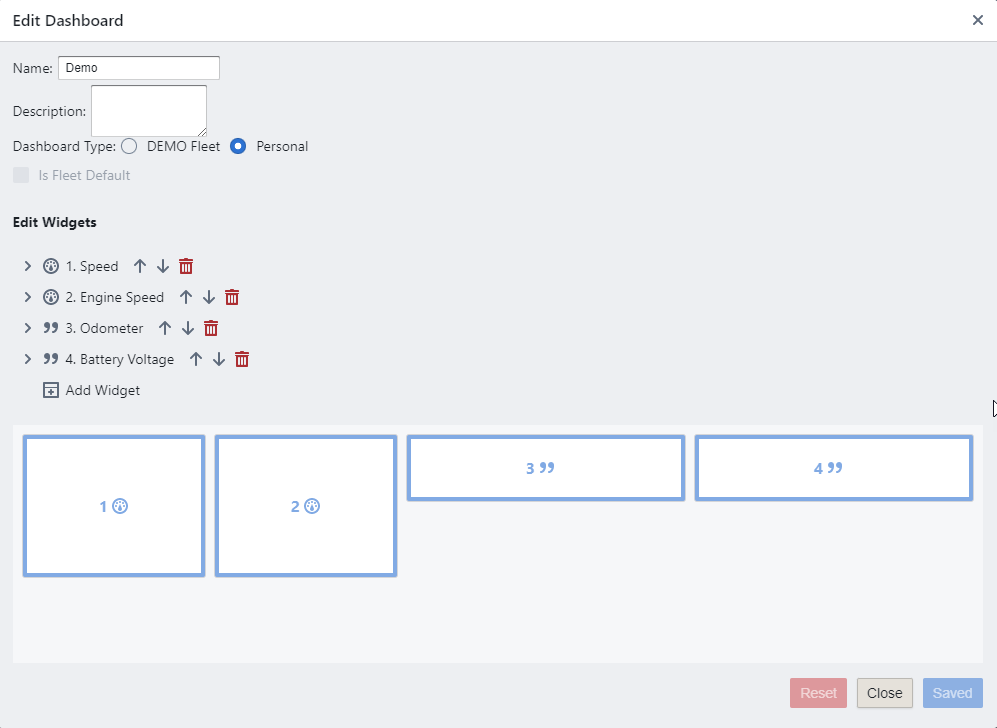
Dashboard Type decides who can see it. Fleet shares it with everyone who has access to that fleet; Personal keeps it to you. A dashboard has to be shared with the fleet before it can be made the fleet default.
Qualifier lays the dashboard out for you based on the size and order of your widgets. The layout preview sits at the bottom of the dialog, and the arrows beside each widget name move it up or down.
Click the expand arrow beside a widget to edit it:
- Alias is the signal you want to display.
- Title is the label that appears on the dashboard. It defaults to the alias, and you can change it.
Click Save, or Close to leave without saving.
Health alerts and notifications
A health alert is the event that turns a vehicle from green to orange. A notification is a pop-up about a recent event.
Both are shared: everyone in your organization sees the same ones.
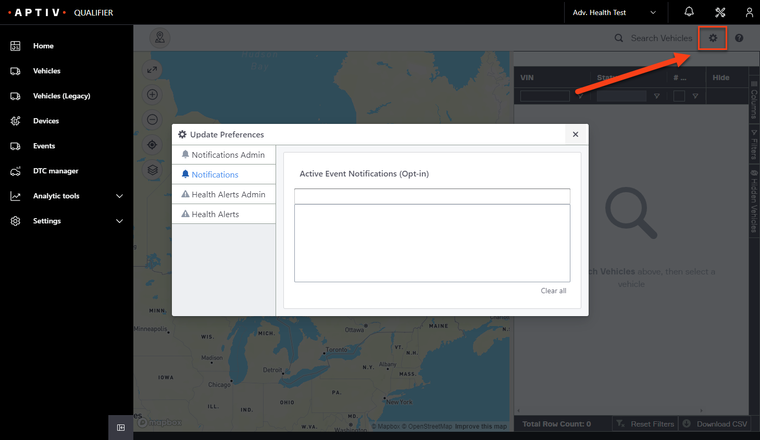
If your access level allows it, click the gear icon and then Notifications Admin or Health Alerts Admin to add, edit, or delete them.