Event Timeline
The Event Timeline lays out the contents of the open file against the same time axis used by your graphs. Instead of plotting signal values, it shows when trips, trip details, events, snapshots, video, and other records occur. The result works much like a Gantt chart for the drive.
Click Event Timeline above the graph section to open it.
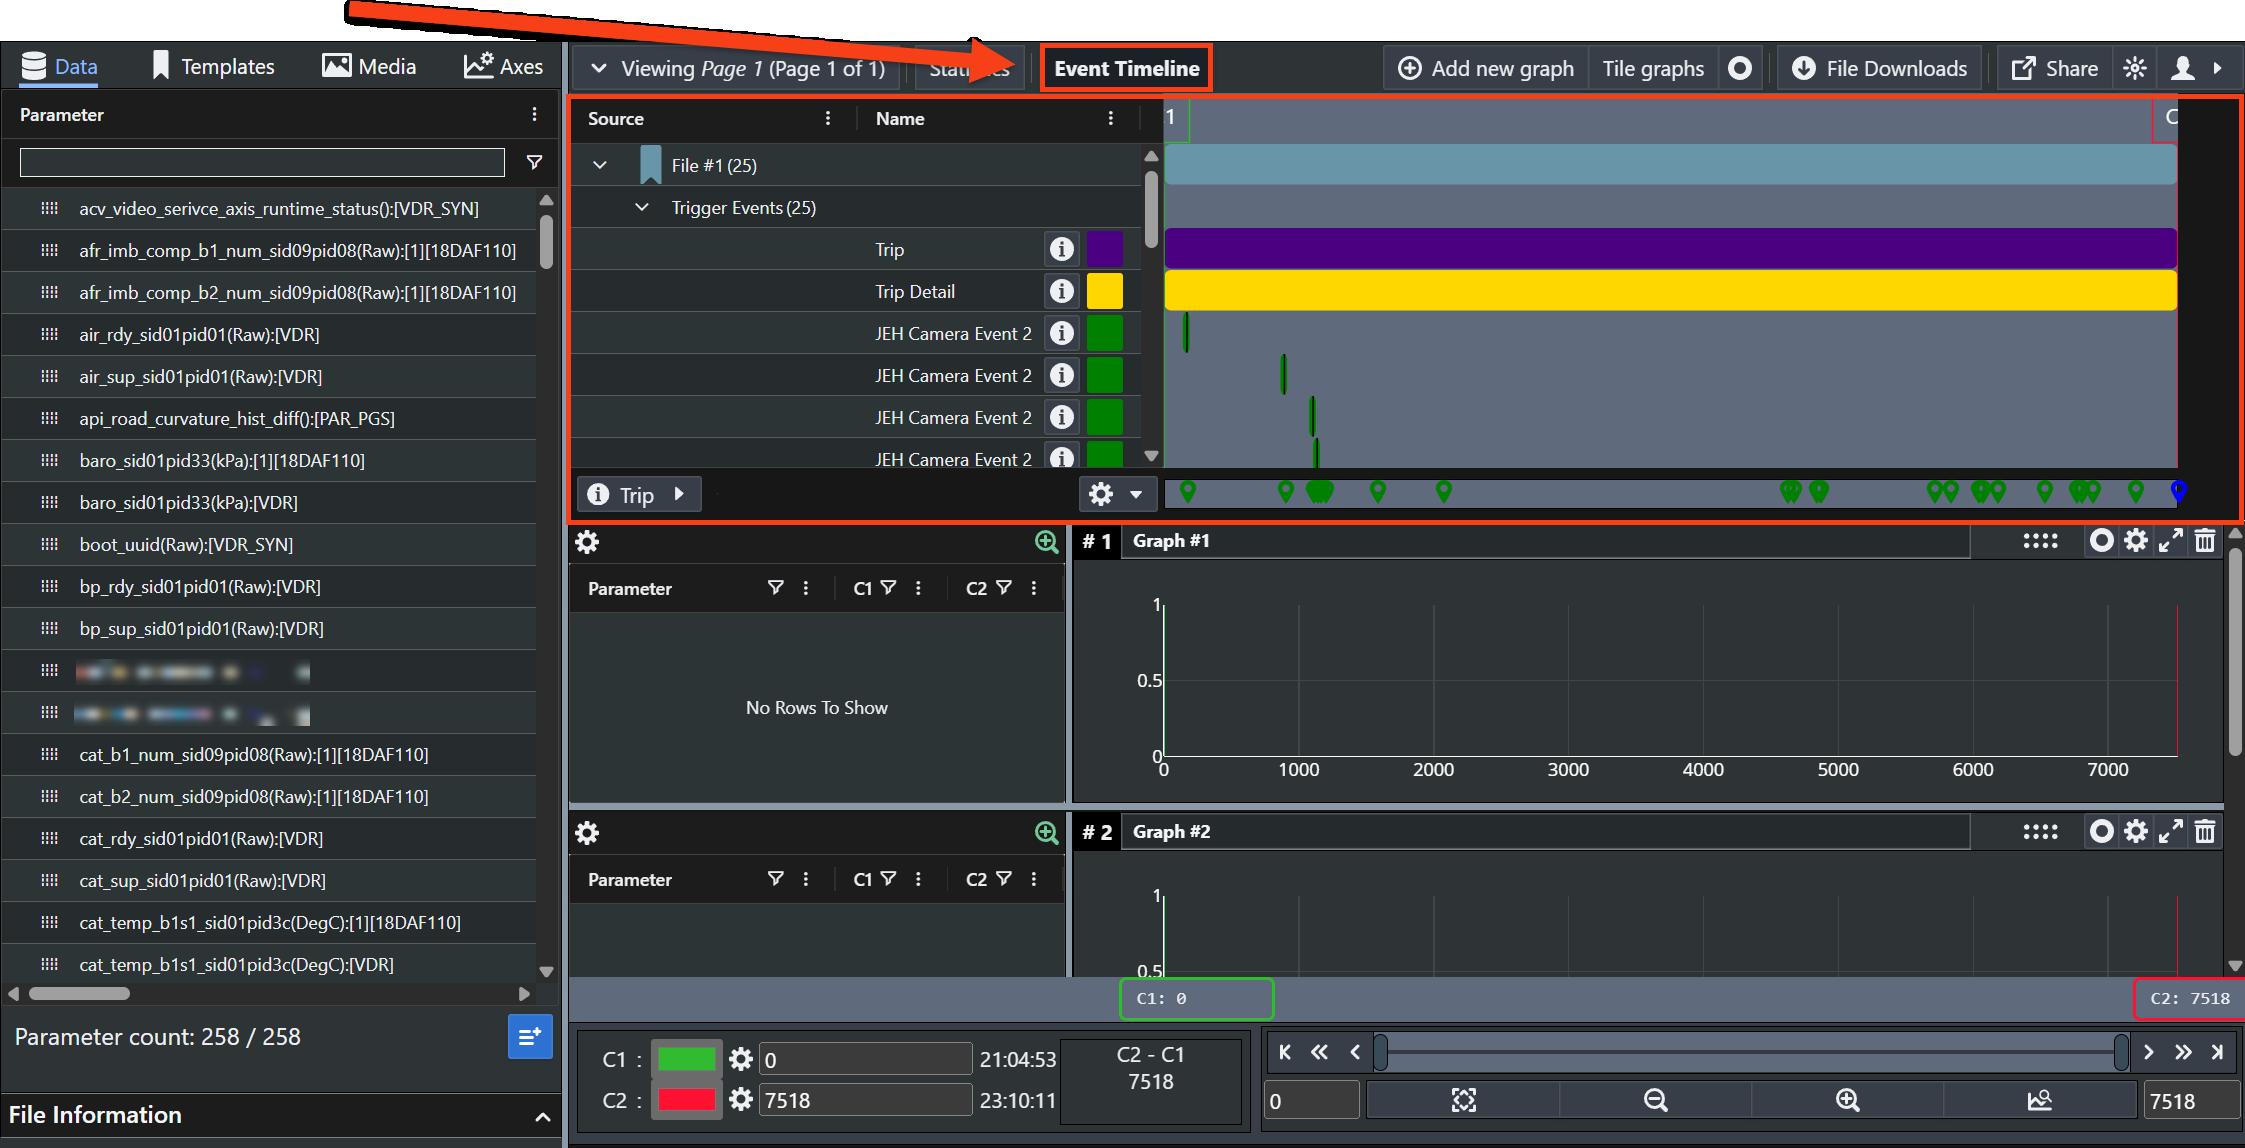
What it shows
What appears depends on the file, but can include:
- Video, with its metadata
- Snapshots
- Trip Detail (RVD)
- DataLog and CANLog, together known as event files
- Lowspeed
- Special files, including Module Cal ID and DTC Manager
- Full trip CANLog (
ct2-dat)
Reading it
The Event Timeline has two halves: the source list on the left and the chart on the right.
Source list
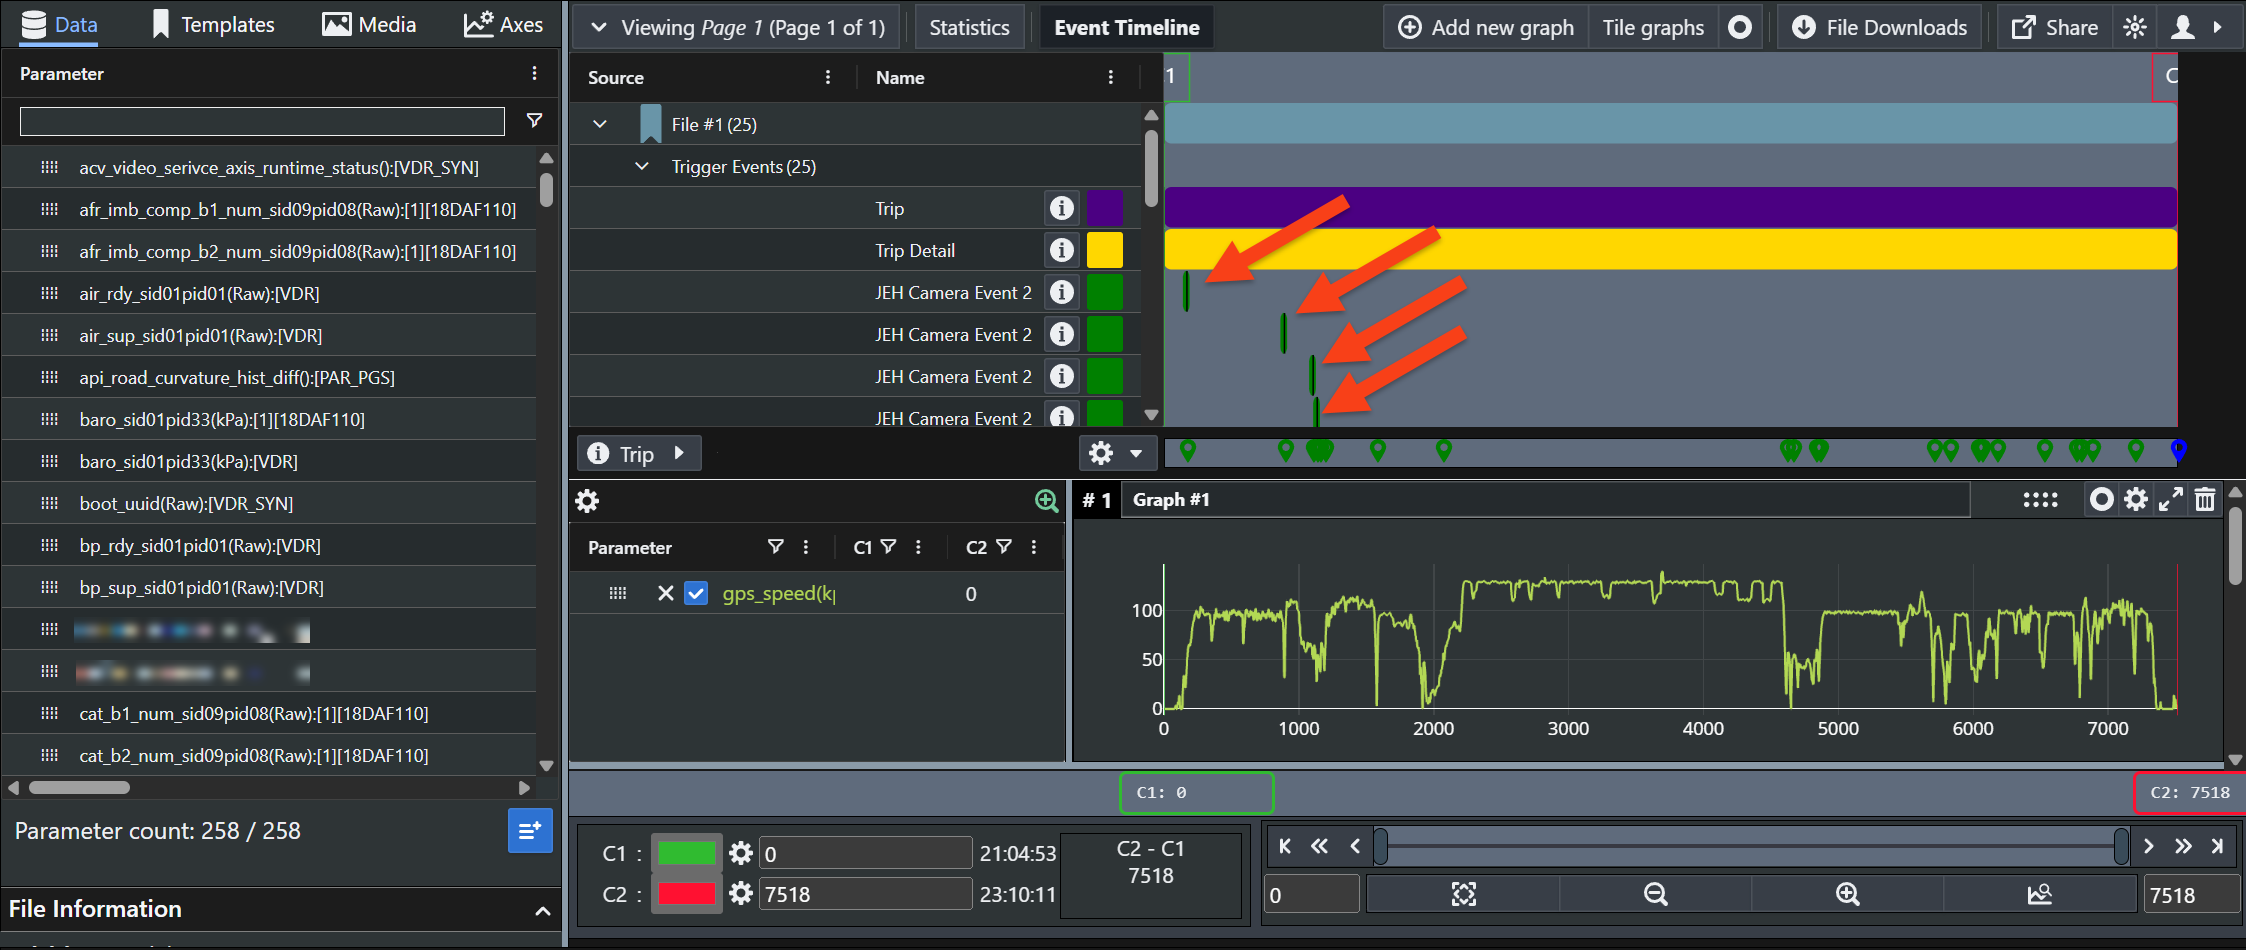
The source list names the open file and everything inside it. In the example below there are four items beneath the filename: a Trip, a Trip Detail, a Less Severe Aggressive Deceleration event, and a Manual Trigger event.

Click the information icon beside any row to open the Trip Detail drawer, which carries the detail for that specific trip or event.
The chart
The chart draws each of those items as a bar across the time axis, so you can see what covered the whole file and what happened at a single moment.
In the example below, one Trip and one Trip Detail span the full duration, and several JEH Camera 2 events occur within it.
Comparing file structure against the data
The Event Timeline is aligned to the graphs below it, and stays aligned. Move the C1 and C2 markers or change the zoom, and the timeline moves with the graphs.
That is what makes the feature useful: you can see at a glance whether a change in a parameter lines up with an event recorded at the same moment.
To control the zoom and markers, see Manage the x and y axes.