Everyday tasks
Qualifier supports different kinds of work. A validation engineer investigating a pre-production issue may follow a very different path from a fleet operator monitoring commercial vehicles. Even so, both depend on a small set of everyday skills: narrowing the data, downloading results, recording what they find, and opening the right analysis tool.
Filter before you do anything else
Filtering is part of the investigation, not cleanup after it. A useful filter keeps the page responsive and leaves you with a data set that can answer your question.
On Home you will find Global Filter Profiles, with two tabs.
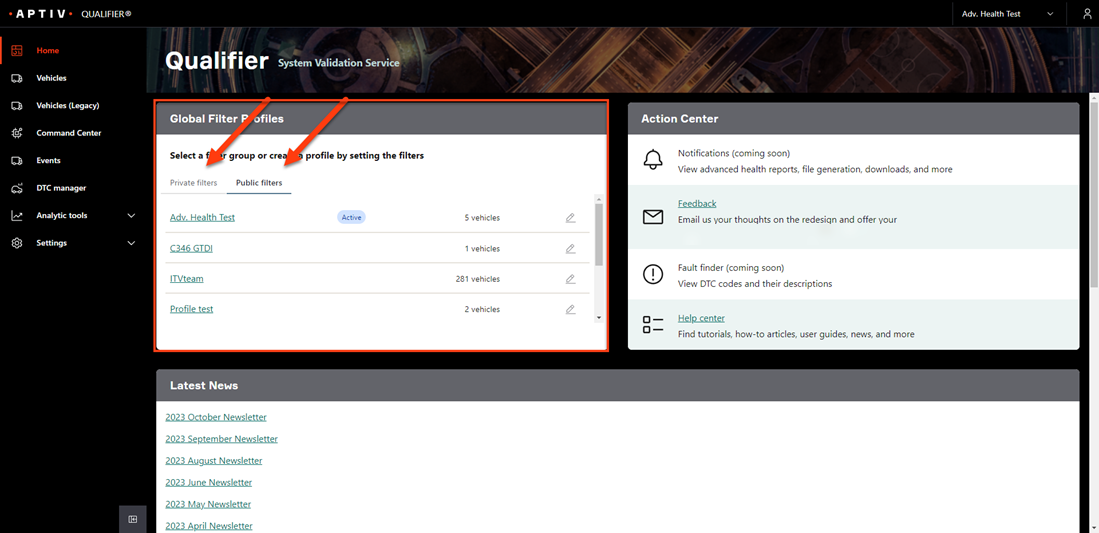
- Private filters are yours alone. Useful for a working list of problem vehicles.
- Public filters are shared across your organization, and invisible outside it. Useful when a team needs to be looking at the same set.
Apply one and it follows you across every page. You can also switch profiles from the selector in the top bar at any time.
See Use global filter profiles.
Download data
The download icon indicates that you can export the data currently in view.
If the data is only available one way, clicking downloads it immediately. On the Vehicles page, for example, the download icon gives you the table as a CSV file.
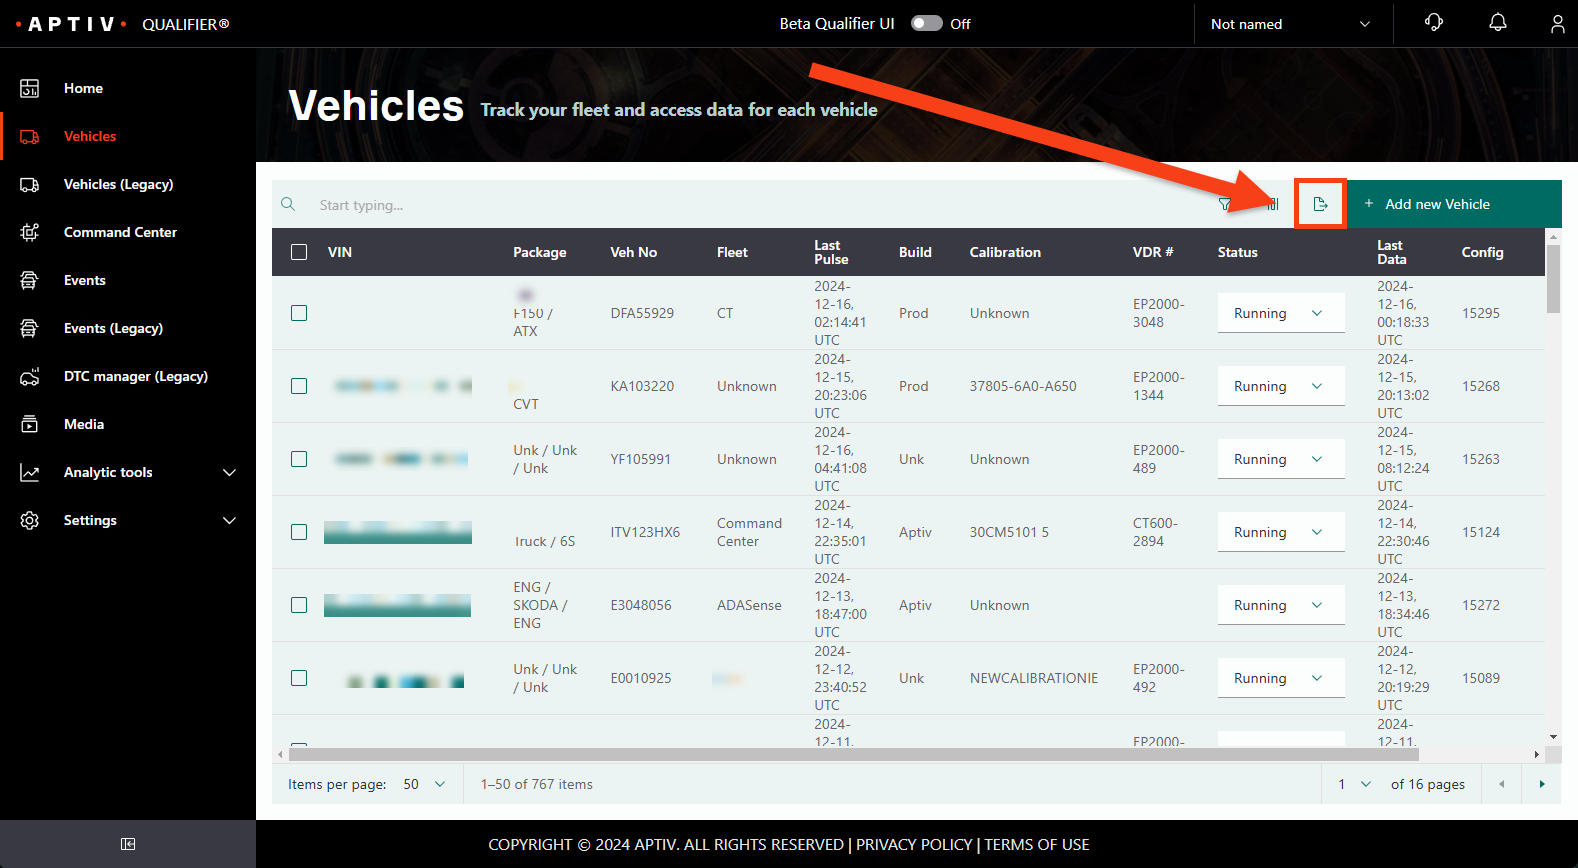
Where several formats are available, clicking opens a menu so you can pick one.
Trip detail rows offer CSV, MDF, and RAW. RAW appears only for users with elevated permissions.
Assign and comment on issues
Both events and diagnostic trouble codes (DTCs) can be assigned to a person and commented on, at the issue level or on an individual occurrence.
Assigning someone sends them an email. Comments stay with the record, so the next person to open it sees what you found.
Changing status at the issue level applies that status to every occurrence underneath it, so use it deliberately. See Events, issues, and occurrences.
Analyze in depth
When tables and summaries are not enough, continue in one of Qualifier's two main analysis tools.
AC-Graph
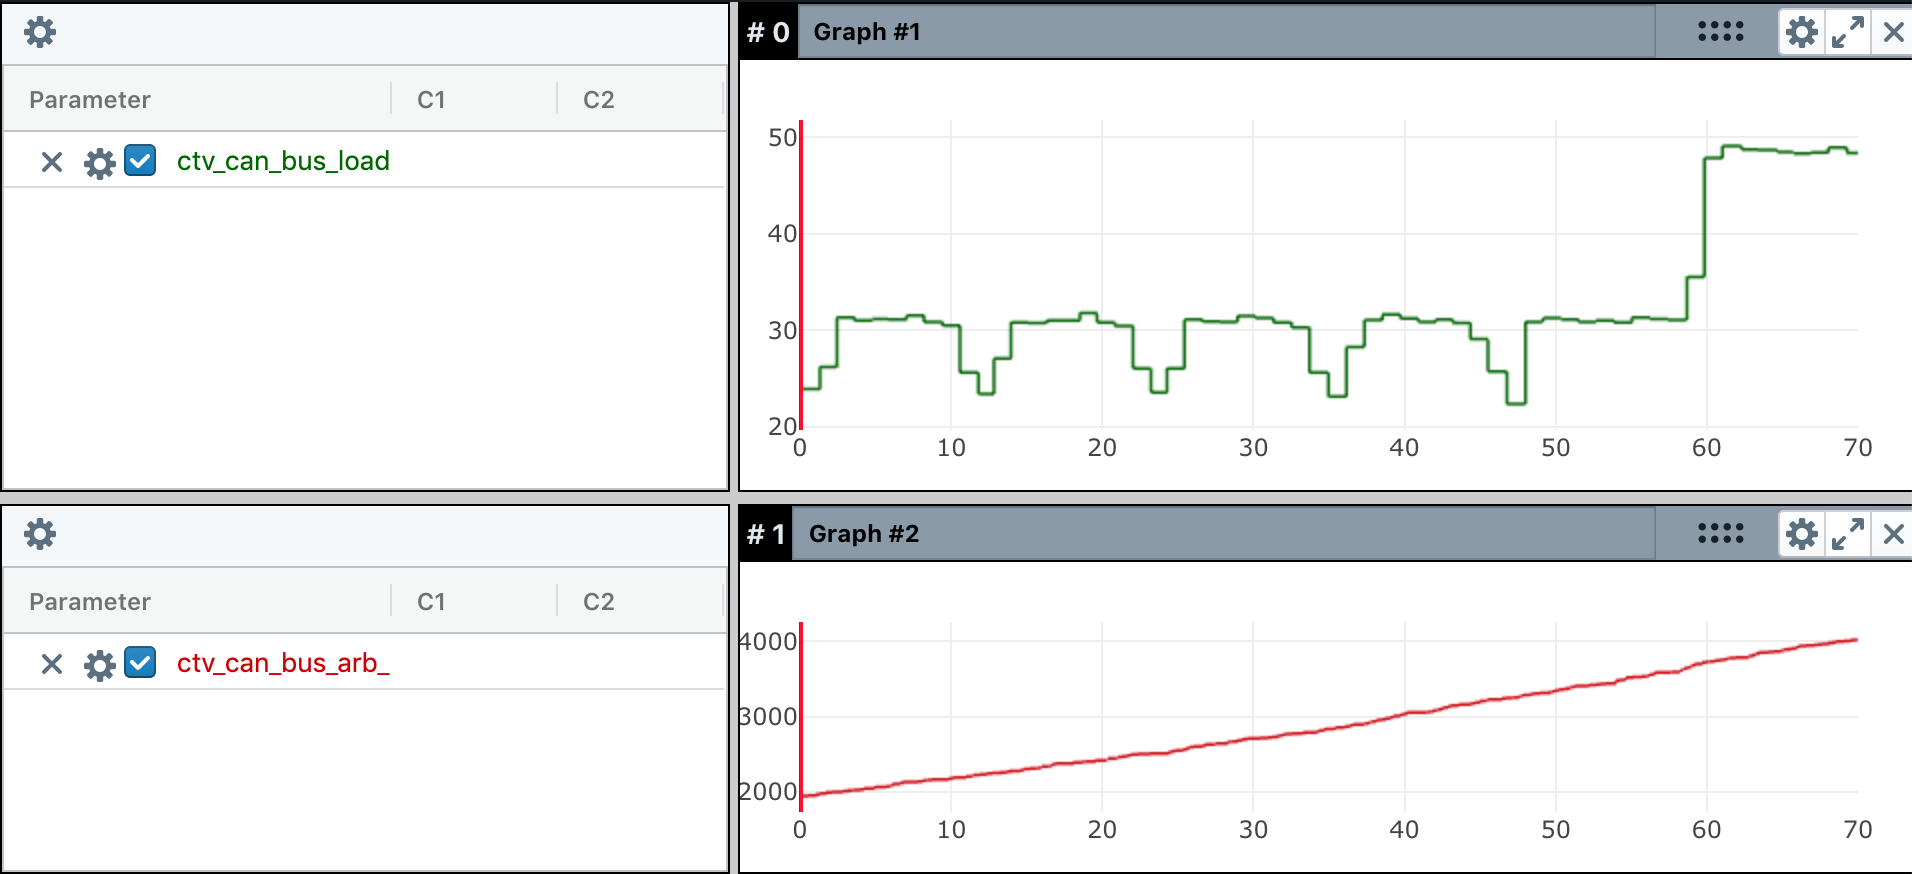
AC-Graph charts recorded data. Open it by clicking the AC-Graph icon anywhere it appears.
Plot how signals moved over time:
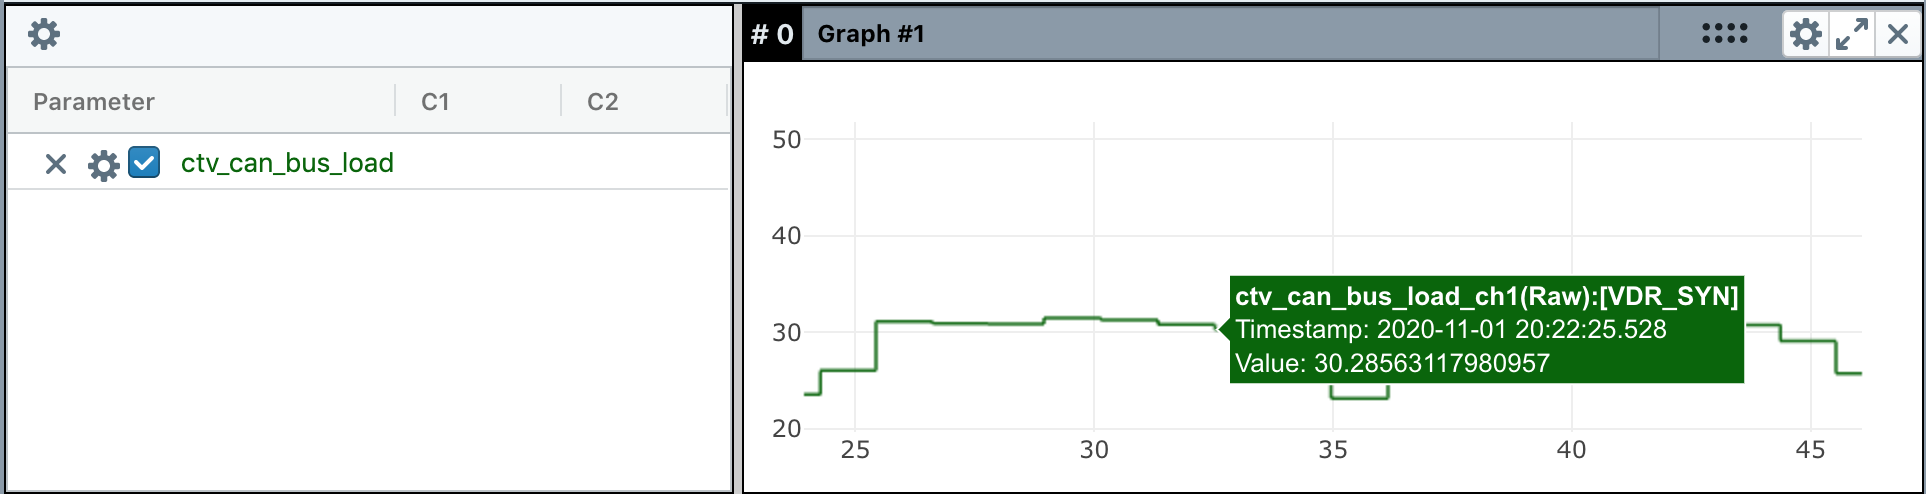
Or zoom in to read exact values at the moment an event fired:
DATALAB
DATALAB prepares and exports data rather than charting it. Use it to concatenate files into one continuous timeline, or to bulk download, with filtering to cut the result down to the parameters and rows you want.
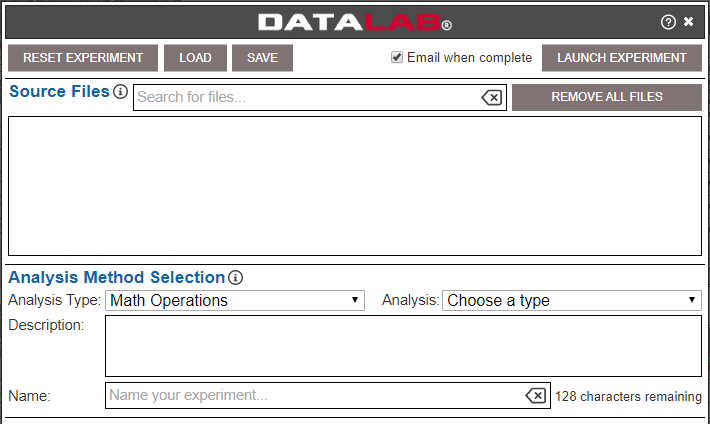
DATALAB processes jobs on the server because they can be large. You can continue working elsewhere in Qualifier and return when the result is ready.