Running the Advanced Health Report
The Advanced Health Report (AHR) brings health metrics, diagnostic trouble codes, events, test results, and supporting charts into a detailed analysis of a vehicle system. It is Qualifier's most configurable standard report.
It covers much the same ground as the Snapshots page, but with more configuration and more advanced statistics.
How an AHR is put together
The filters determine the scope of an AHR, so understanding their three levels is the key to understanding the result.
- System family. A group of related systems, for example the engine family or the on-board diagnostics (OBD) family.
- System. A specific system inside that family.
- Test results. For each system, a test result analyzes a particular parameter or alias from a snapshot or trip file, calculates metrics, and applies health rules.
The report also pulls in the DTCs and events associated with the systems you selected.
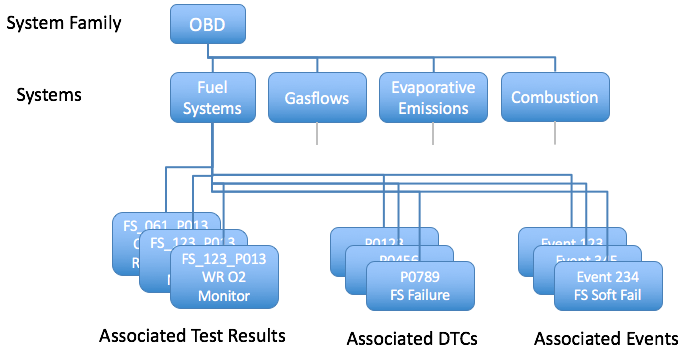
Aptiv works with your organization to design the required AHR definitions. In most cases, you select and run an existing report rather than creating its underlying design.
Running one
Generate an AHR from the Reports page. Create a report, choose the Advanced Health Report type, set your data filters, and submit.
Qualifier runs it in the background, so you can keep working while it processes.
Reading the report
The online result is divided into expandable sections. Click the plus icon beside a section name to open it and the minus icon to close it.
There are two major parts: the Report Summary and the Report.
Report Summary
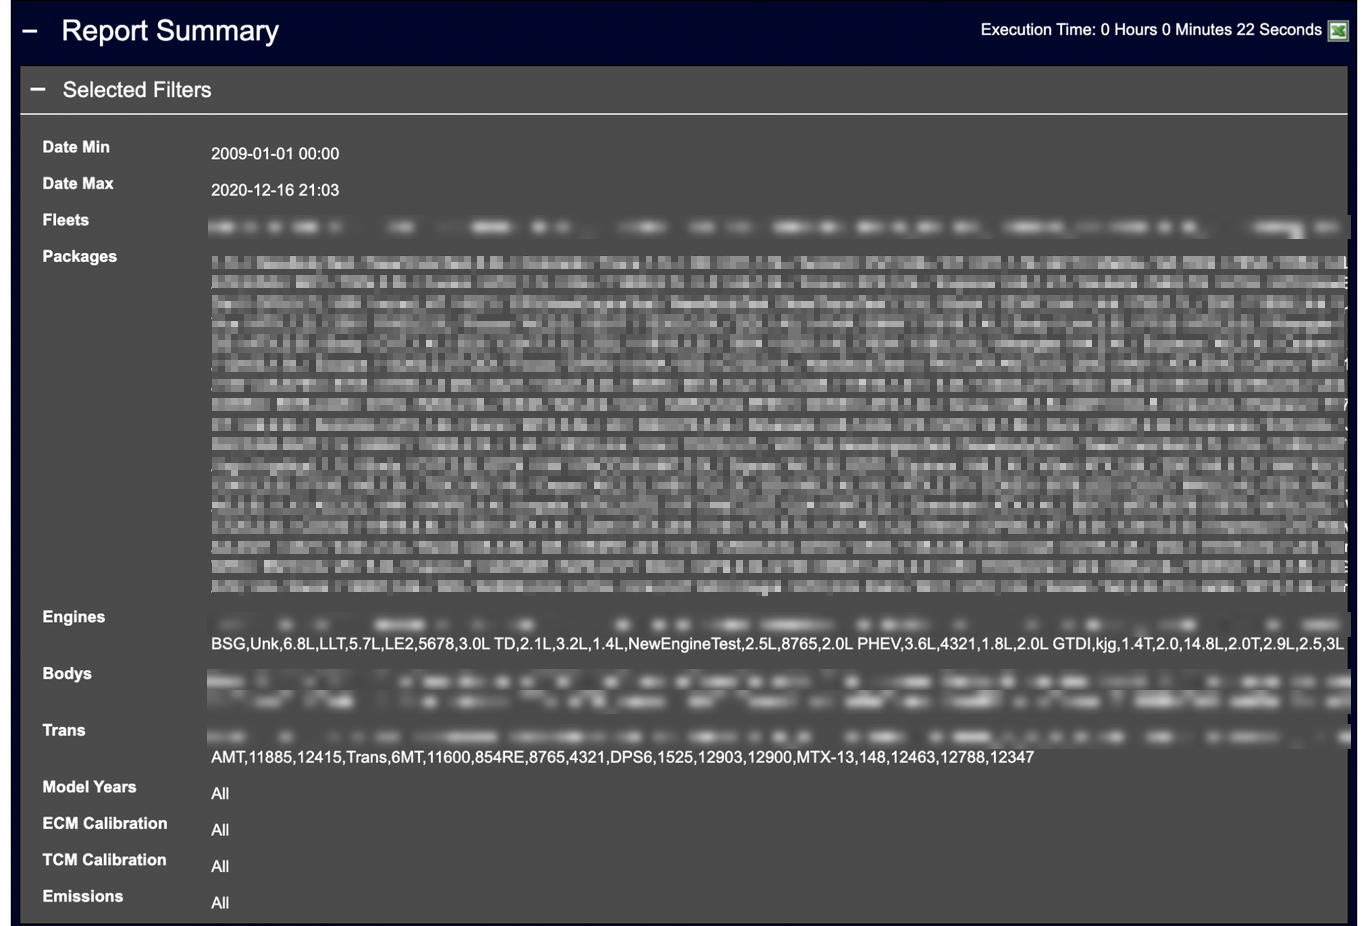
Selected Filters records the filters the report ran with. Check this first when a report does not contain what you expected.
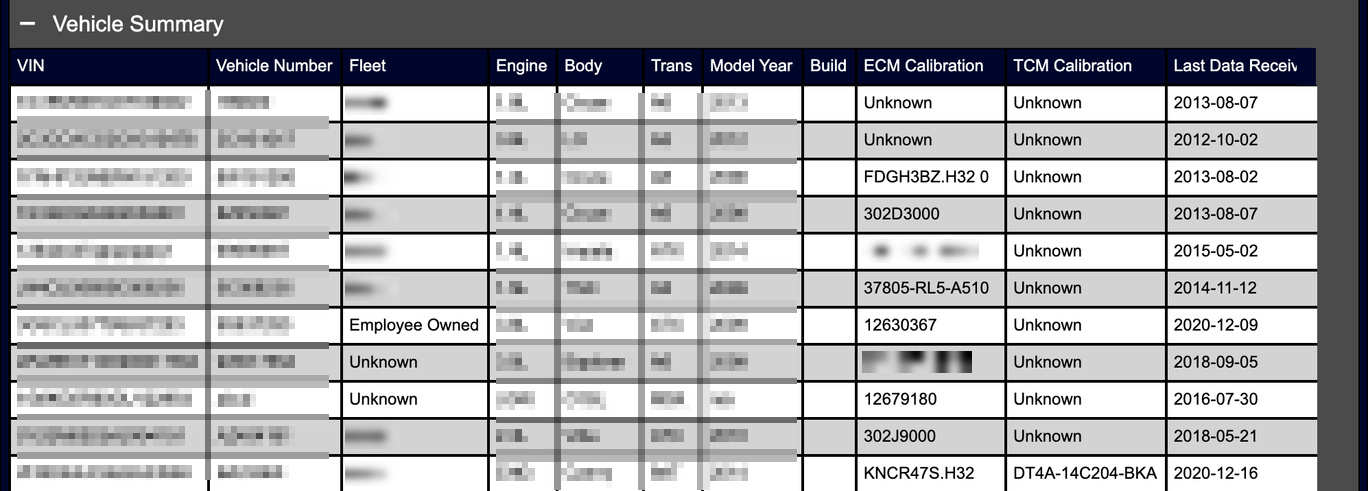
Vehicle Summary tables the vehicles the report covered.
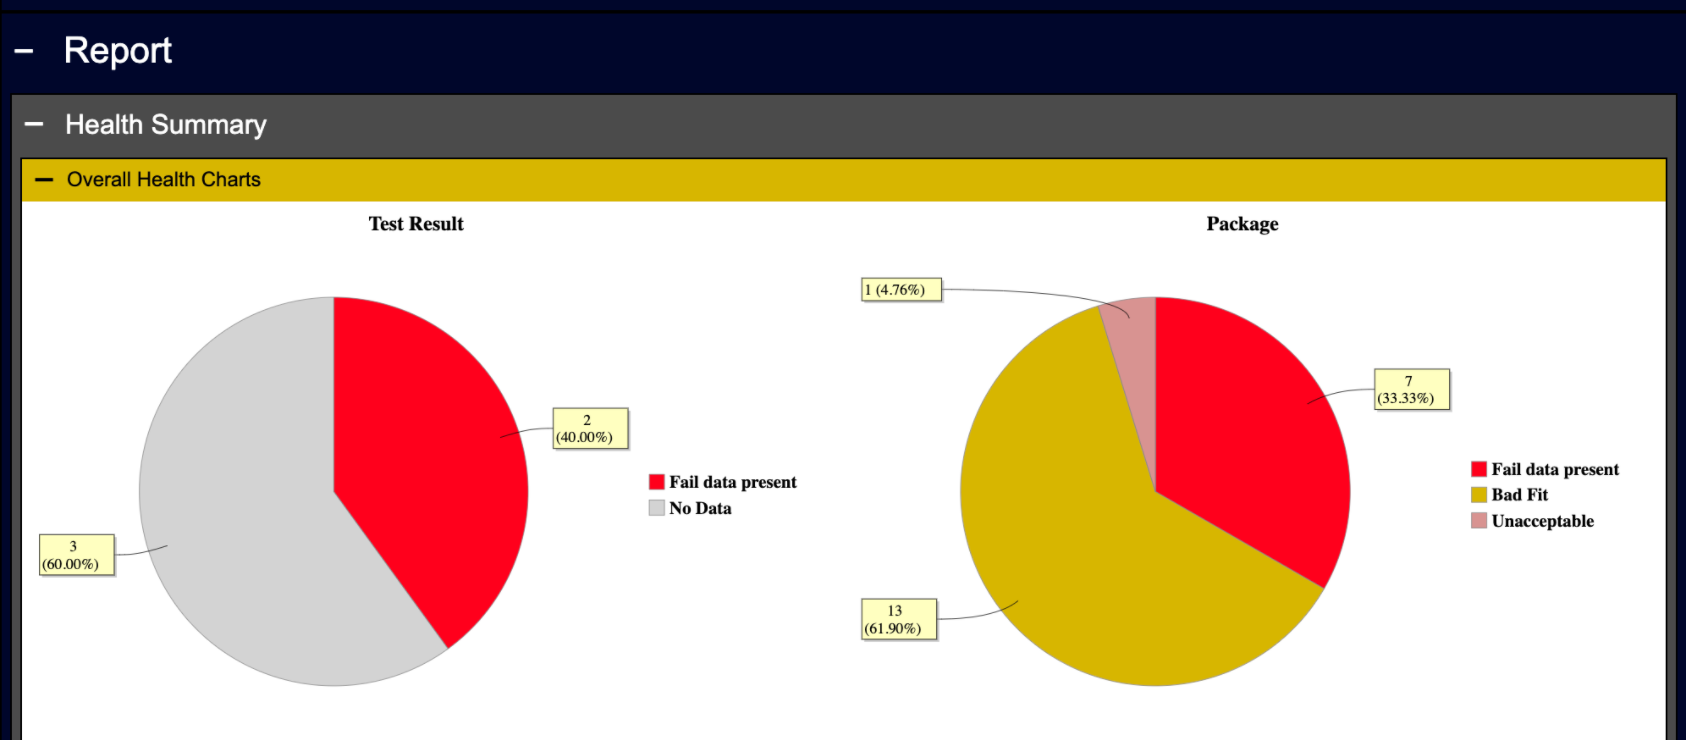
Health Summary
Overall Health Charts gives pie and Pareto charts for test results, DTCs, and events.
Health Summary Tables holds the data behind those charts, with a subsection per system, each broken into test results, DTCs, and events.
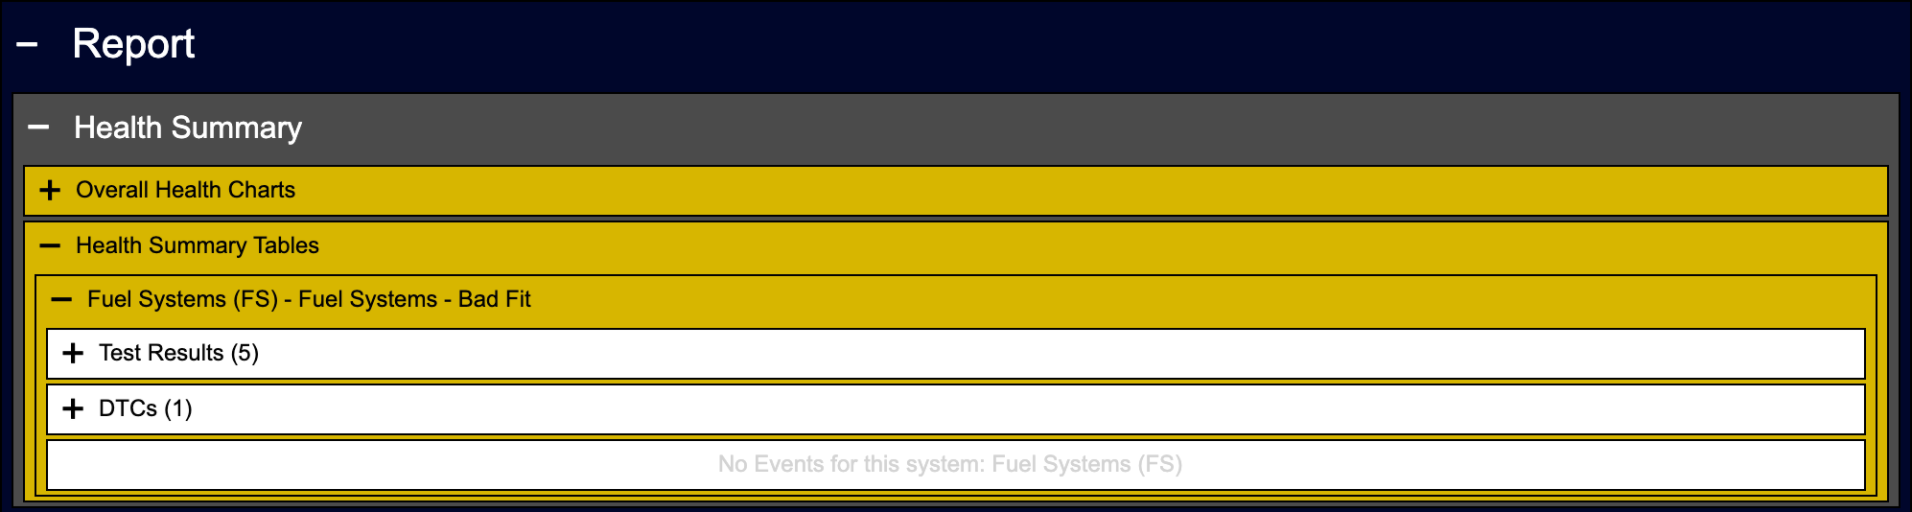
Those tables carry the data alongside statistical metrics, including Cpk, and the target metrics defined for them.
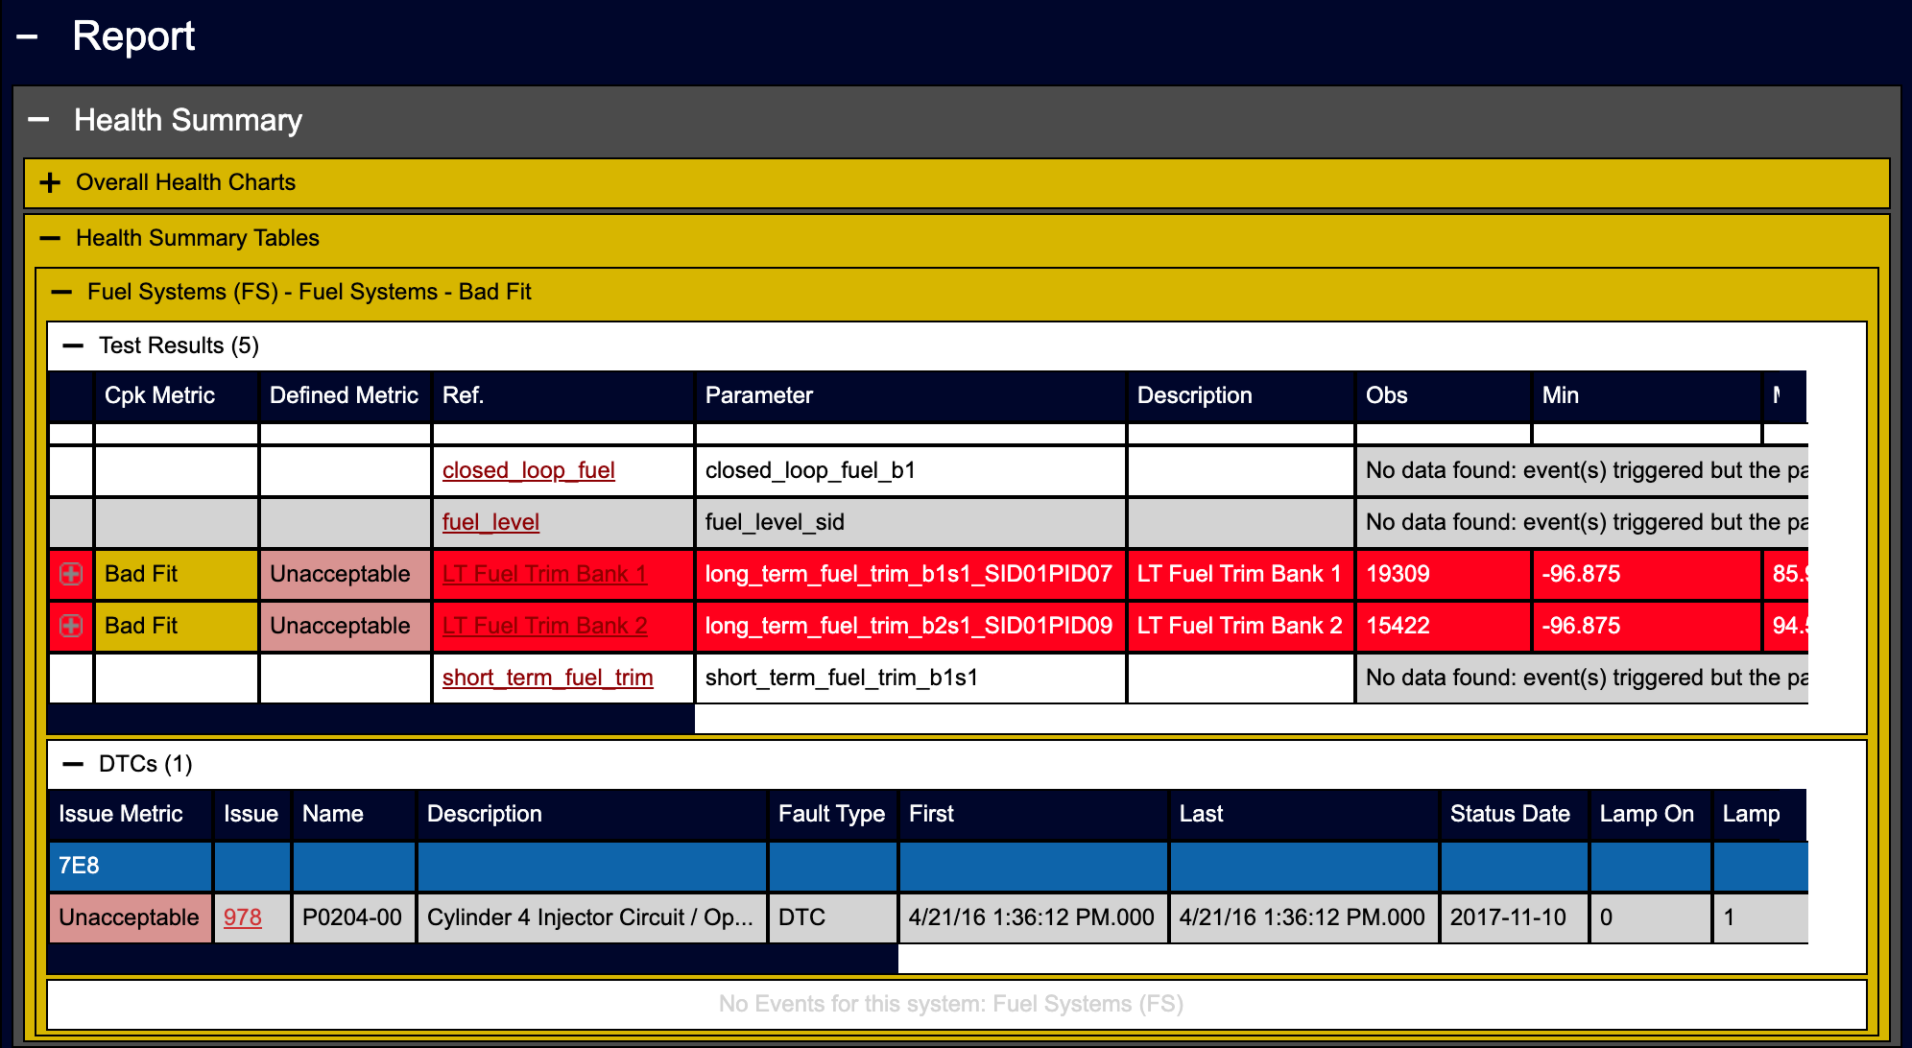
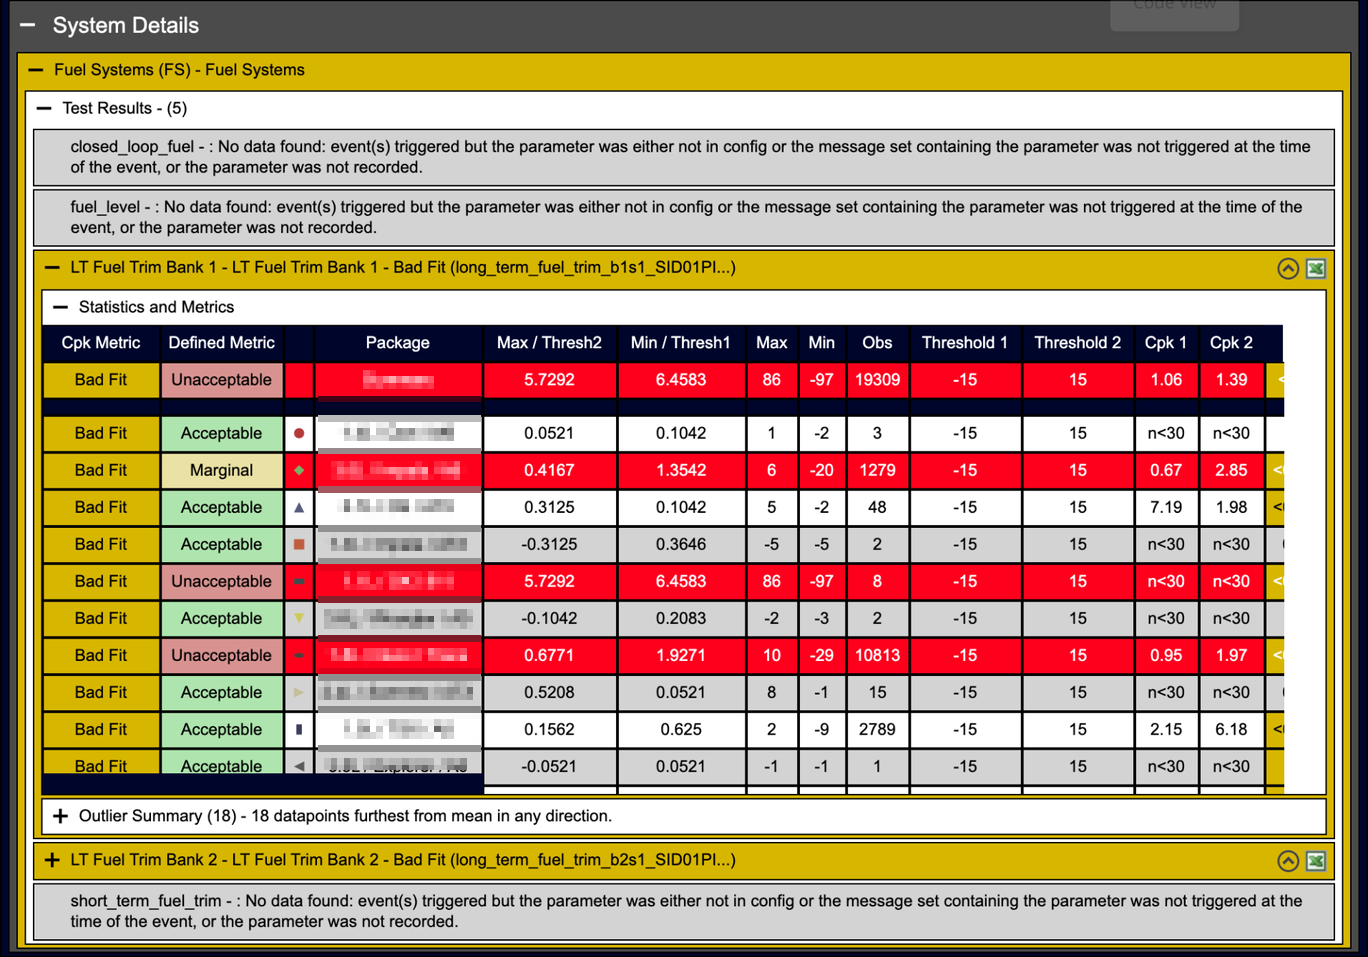
System Details
One subsection per test result. Where data exists, you also get a Statistics and Metrics section with Cpk, target metrics, and an Outlier Summary.
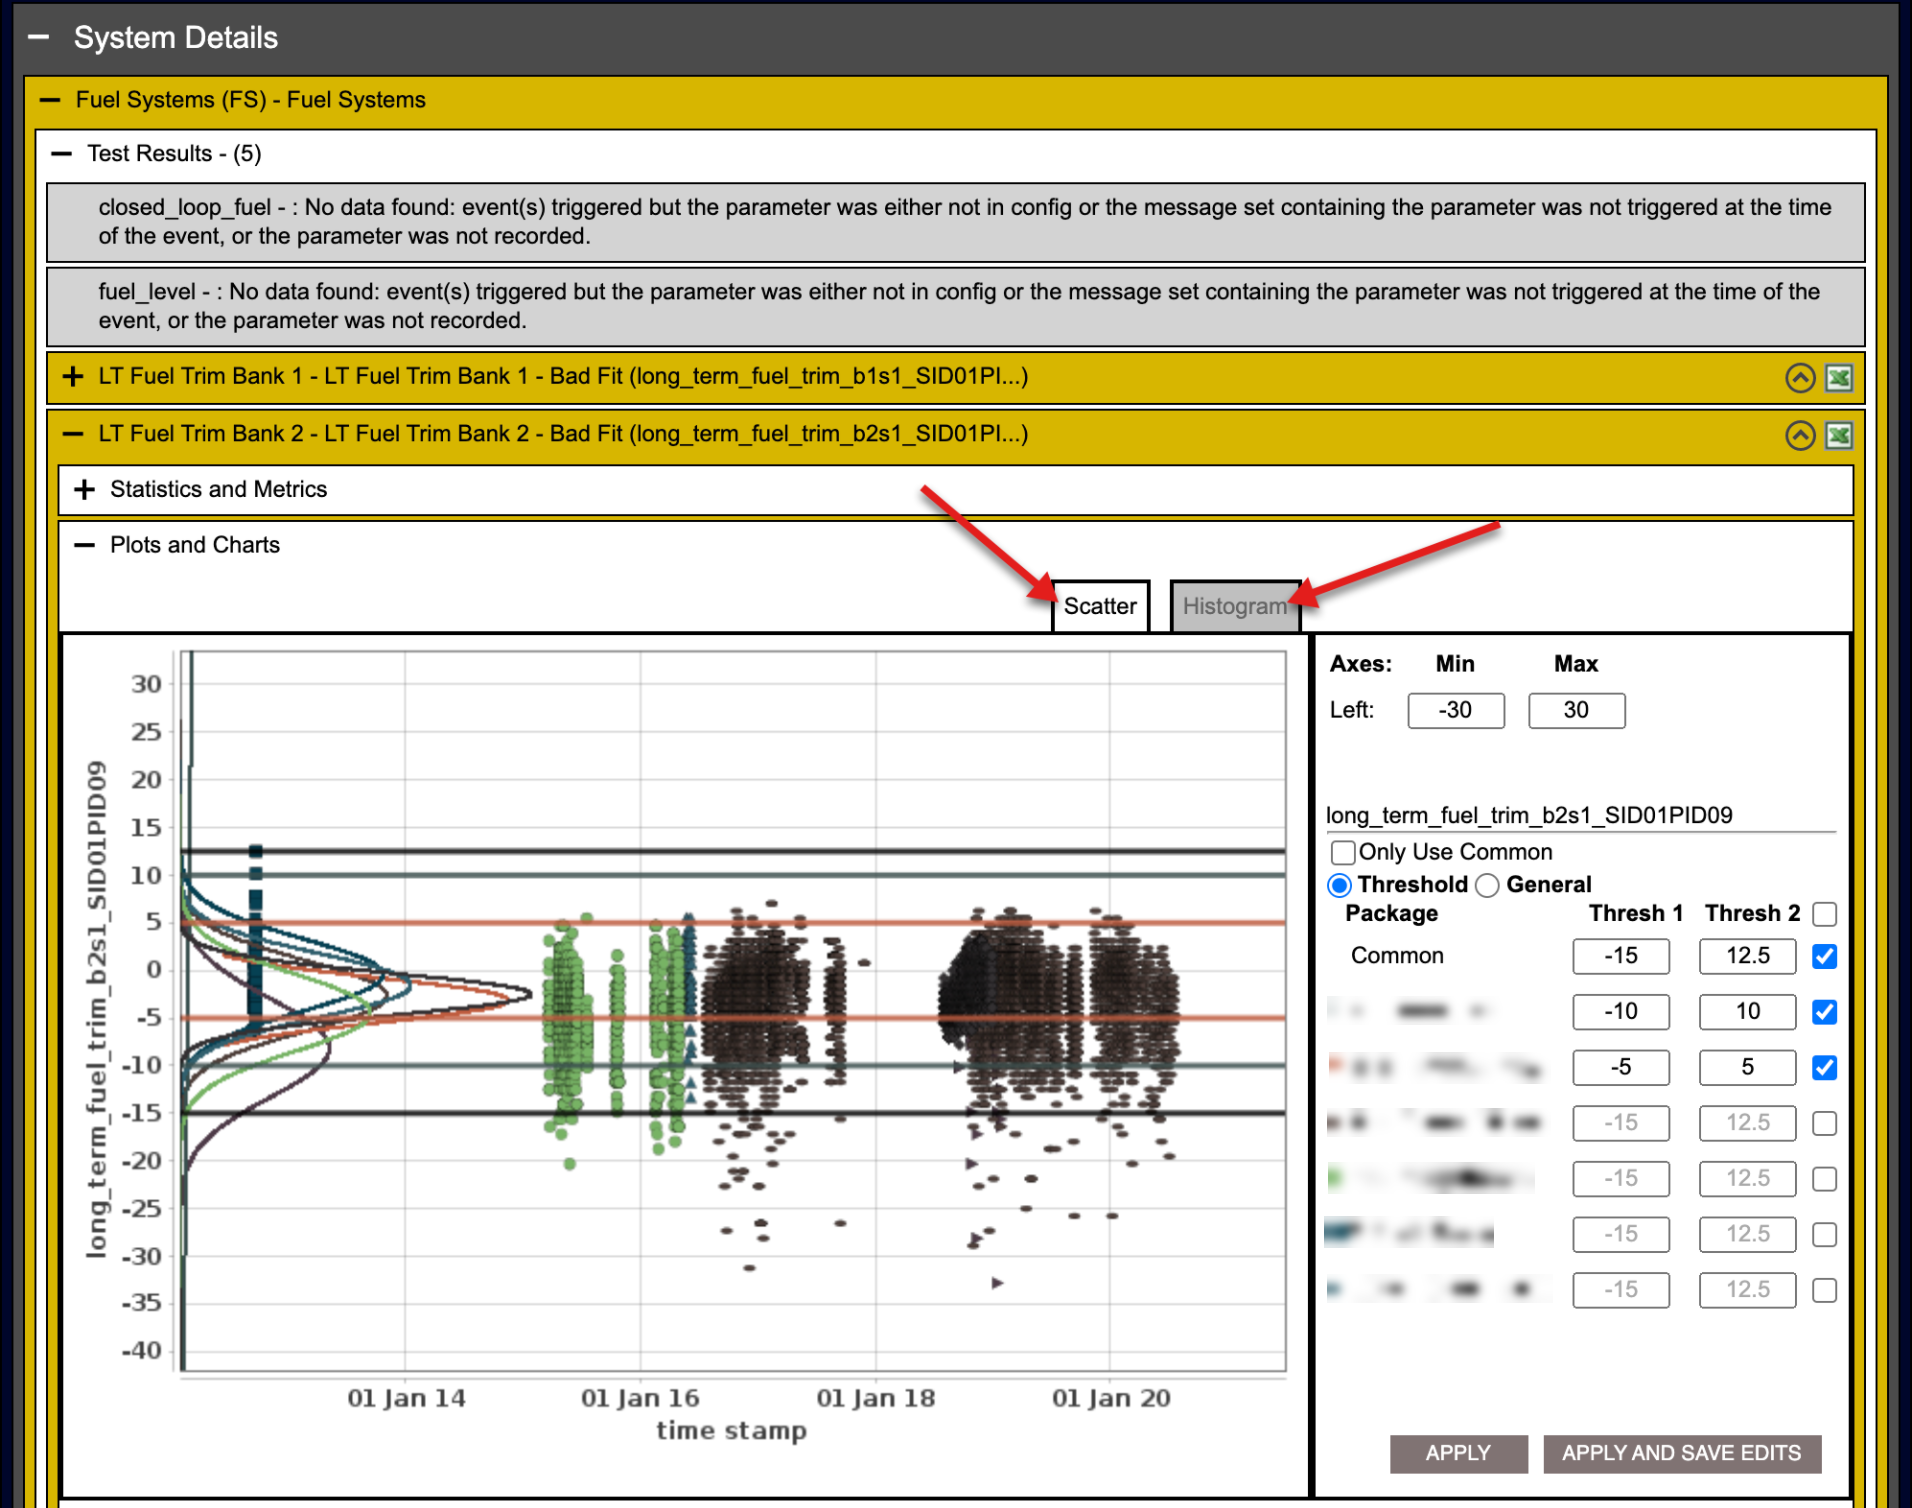
Depending on how your organization configured the report, there may also be a Plots and Charts section, with Scatter and Histogram tabs. The controls on the right adjust their appearance.
The Excel version
Click the Excel icon anywhere it appears, or Download Excel at the top right, to get a spreadsheet version.
The workbook contains macros, and your spreadsheet application may ask whether to enable them. Enable the macros if your security policy permits it. The data remains visible without them, but the charts will not update as you move through the workbook.
The workbook has tabs for Report Summary, Vehicle Table, Health Summary Table, Overall Health Charts, System Definition Detail, and Missing Test Results. It opens on the Health Summary Table.
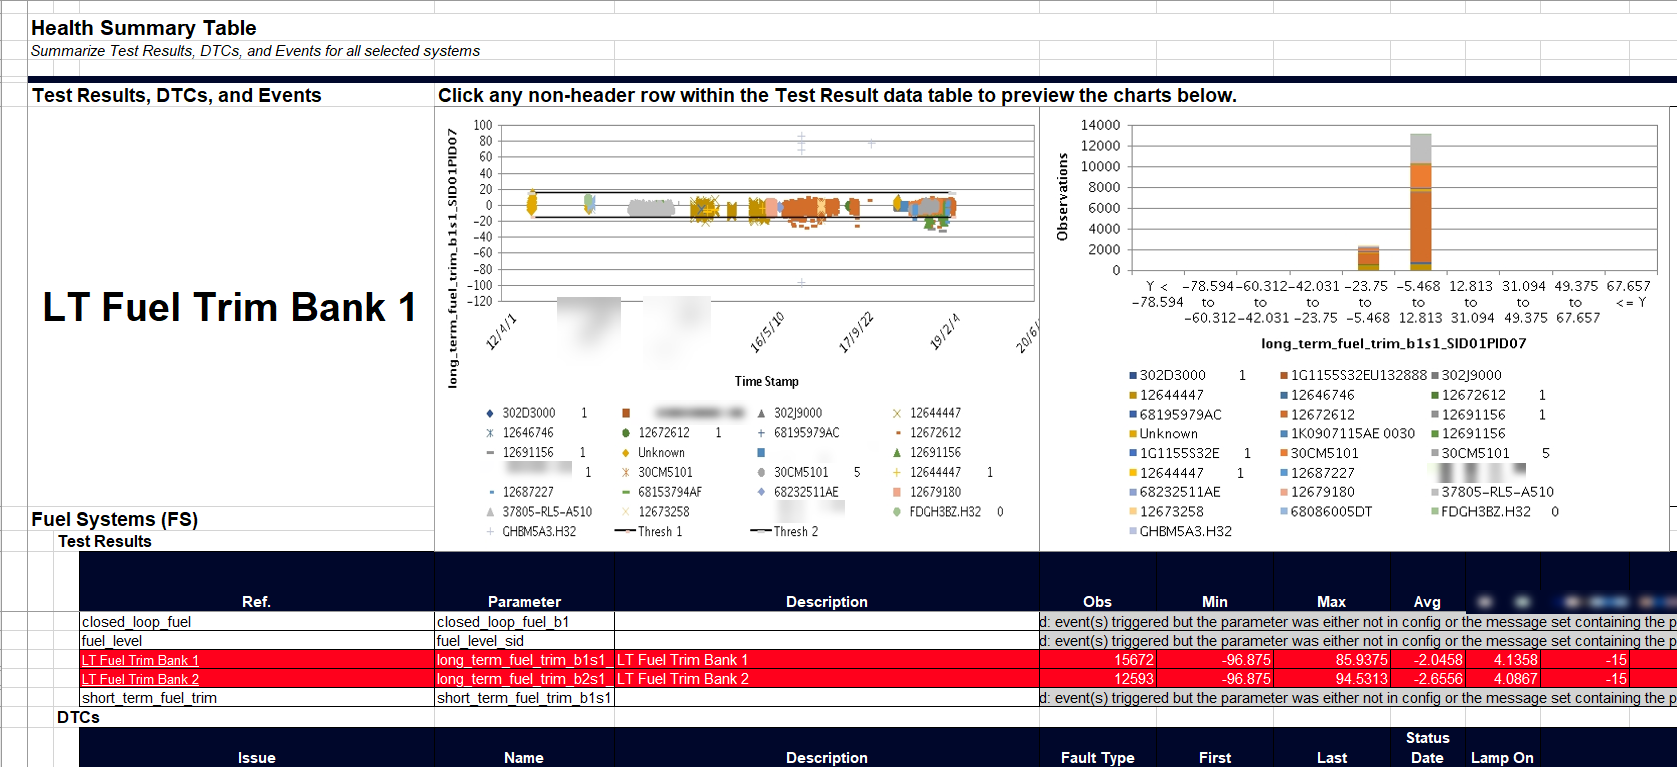
Clicking a row containing data updates the charts at the top of the sheet.
Three things worth knowing
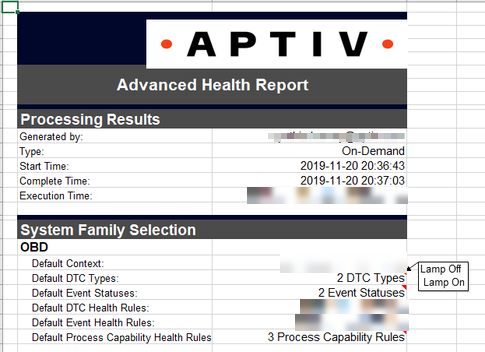
A red triangle in the corner of a cell means there is more behind it. Hover to see the data or the rule that produced the value.
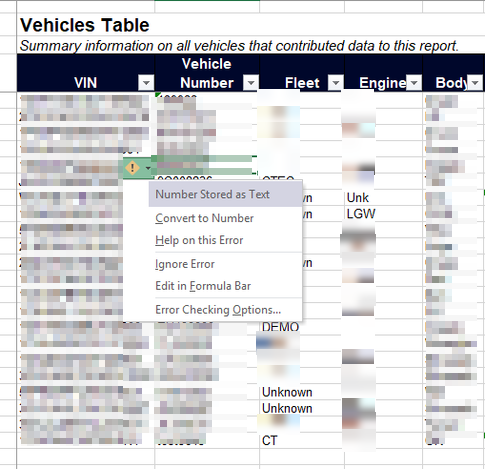
A green triangle is Excel thinking you have made a mistake. Usually you have not. It generally means a number is sitting in a text field, which is expected for fields that can hold letters, numbers, or both. Click it for Excel's explanation.
The links only work in place. The workbook links to pages in Qualifier and to other spreadsheets in the same zipped folder. Move the spreadsheets to different folders and those links break.