What is AC-Graph?
AC-Graph turns recorded vehicle data into time-aligned charts for investigation and comparison. Open it from a trip, event, or diagnostic trouble code (DTC) file in Qualifier, then add the parameters that matter to your question.
With AC-Graph you can:
- Plot how any parameter changed over the course of a trip
- Put several parameters on one chart, or several charts on one page
- Sync your charts with GPS location and video from the same drive
- Save a layout as a template and reuse it
- Share a graph with a colleague
When you need an exported data set rather than an interactive view, use DATALAB. DATALAB produces files; AC-Graph produces charts.
What you can do with it
Chart a parameter over a trip
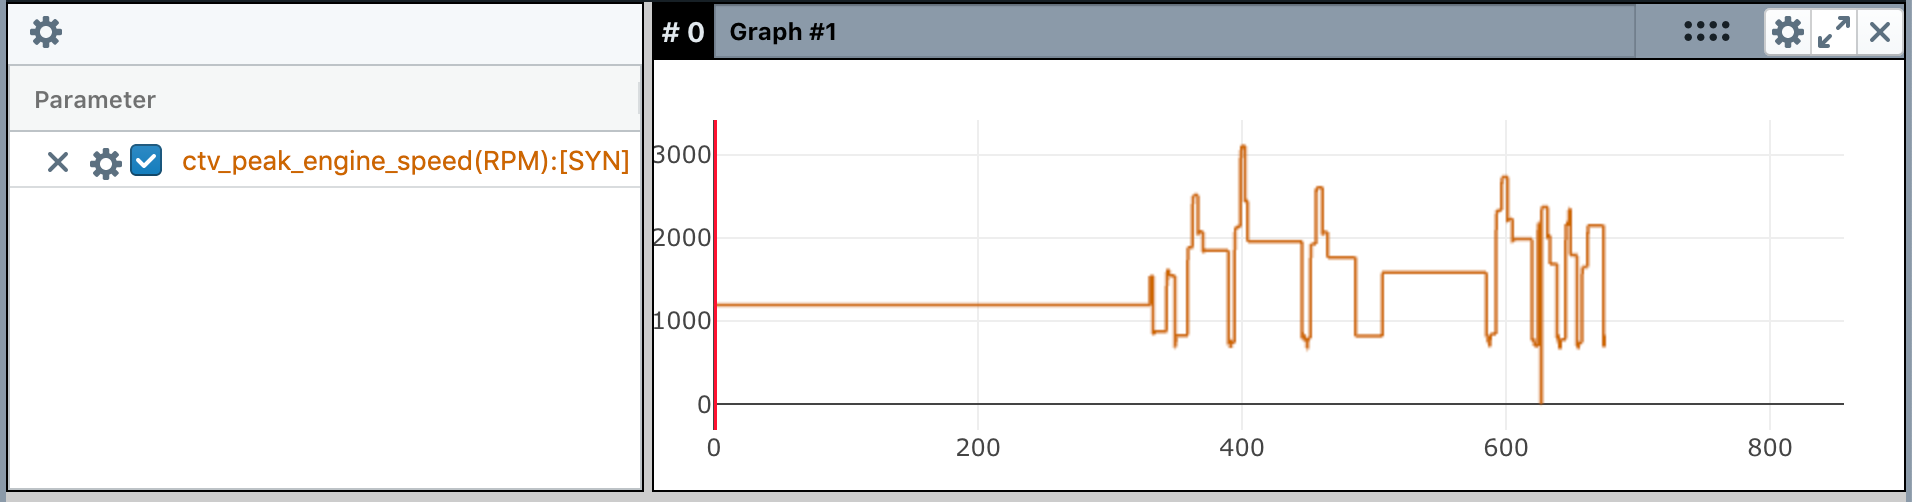
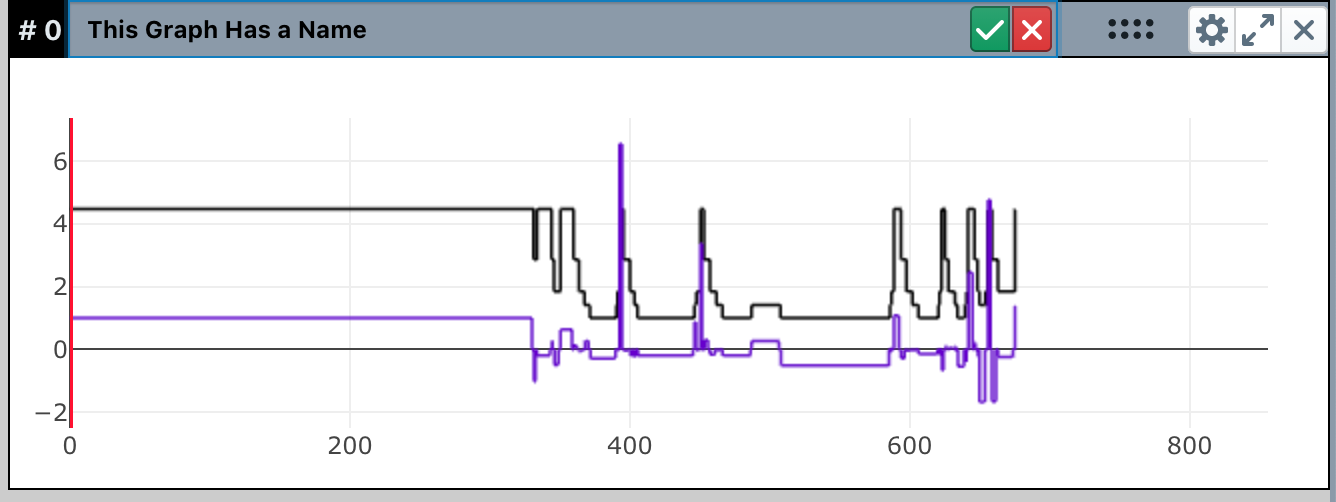
You can track several parameters on the same chart:
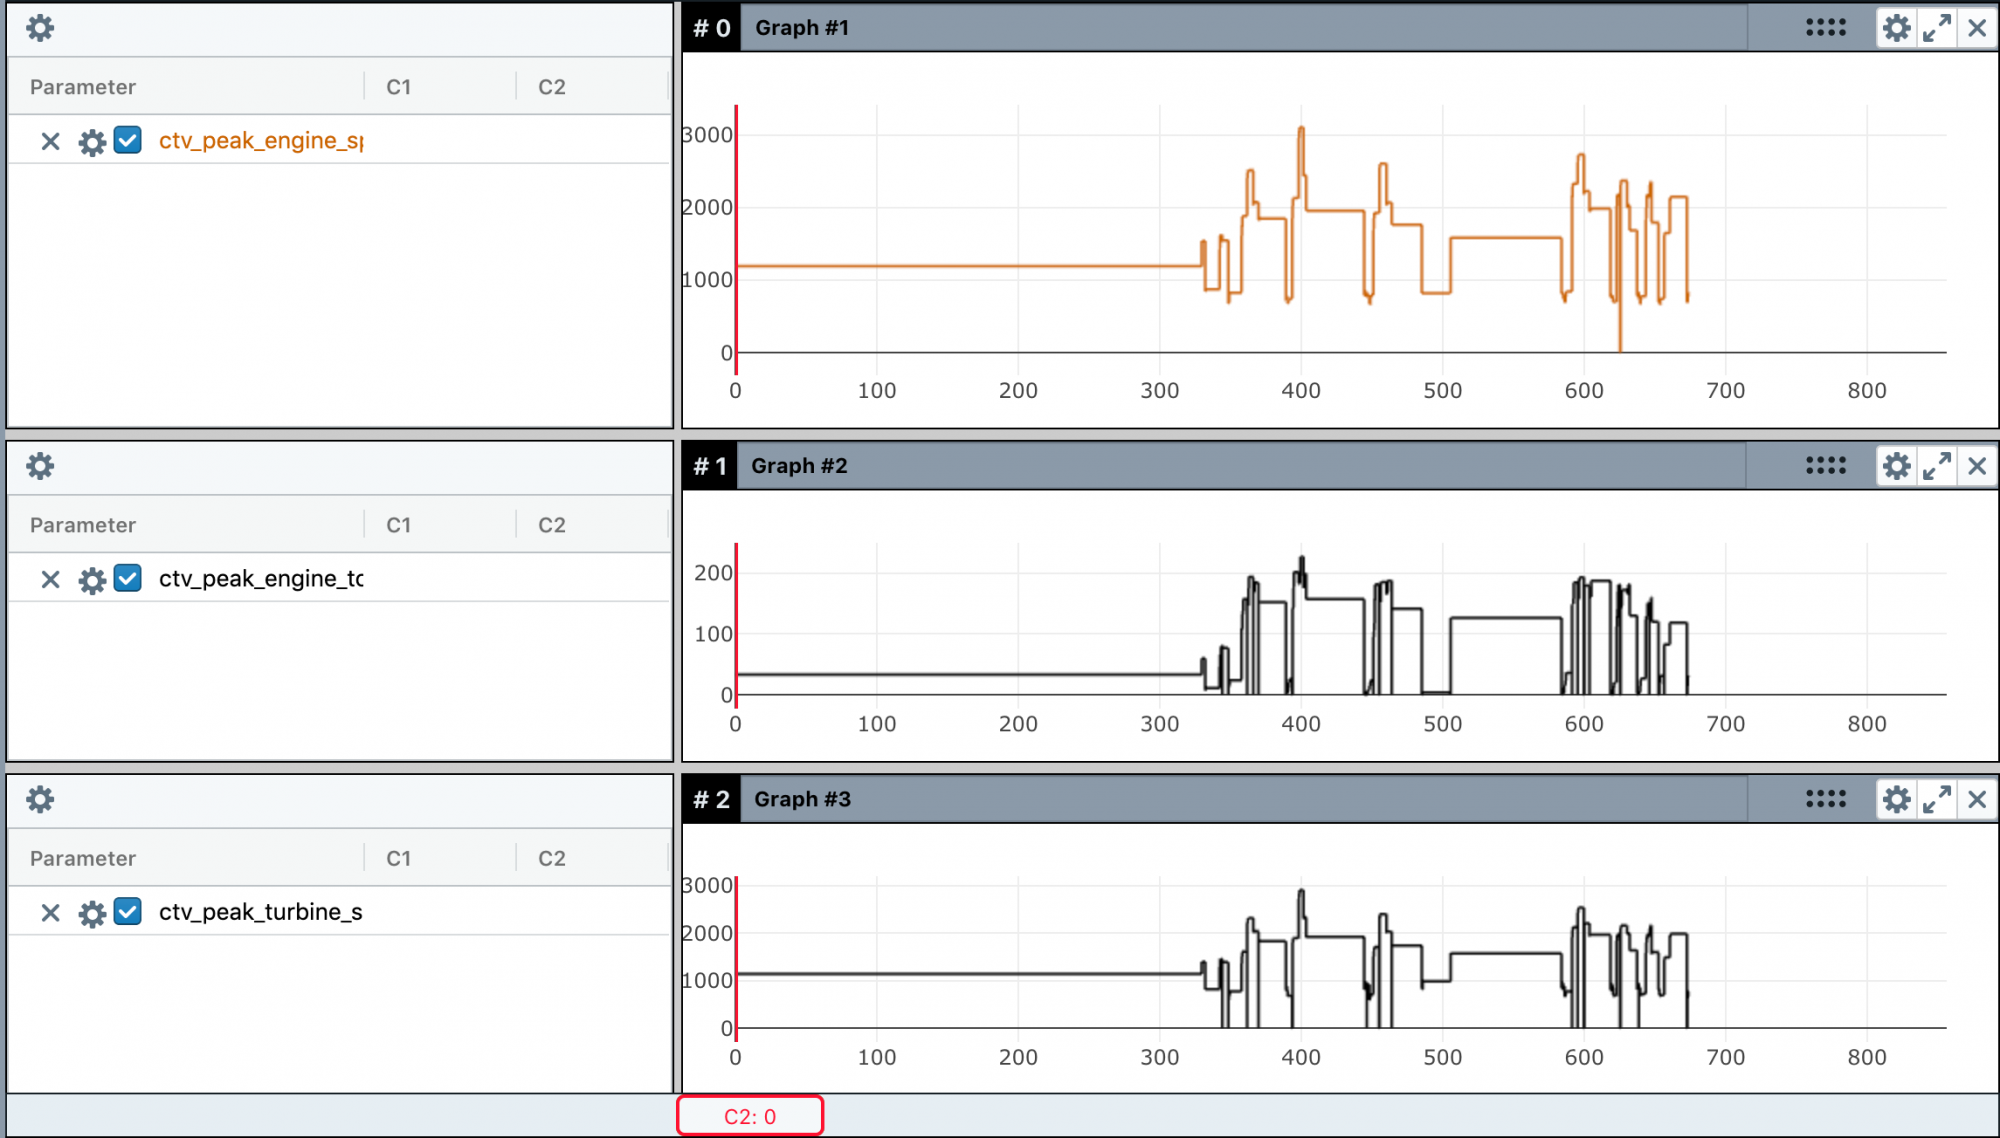
View several graphs at once
Graphs on a page share the same time period, so you can read them against each other. Hover over any graph to see the value at that point.
Watch video alongside the data
Where a trip has video, AC-Graph plays it in step with the charts, so you can see what the vehicle was doing when a value changed.
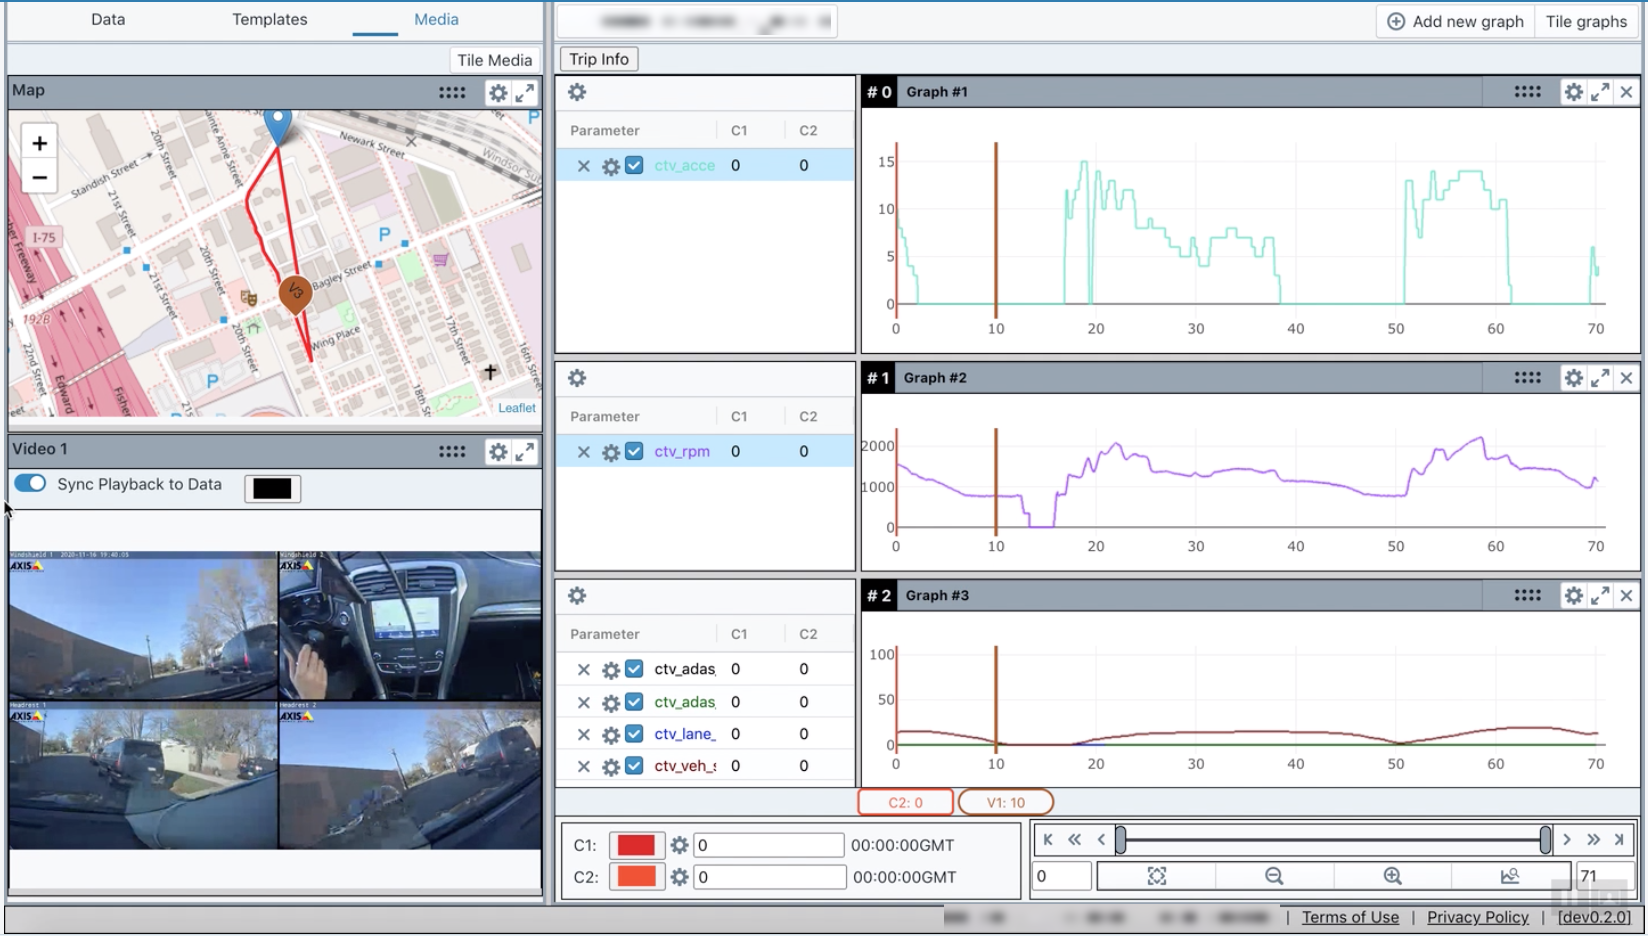
The interface
| Section | What it holds |
|---|---|
| Parameter list | Every signal available in the open file |
| Legend | The parameters currently plotted on the graph beside it |
| Graph | The plotted data, with time on the horizontal axis |
| Event ribbon | Markers showing when events occurred during the period on screen |
The tabs above the parameter list switch between Data, Templates, Media, and Axes.
Time controls
The time controls sit below the graphs. They let you zoom into a portion of a file precisely, and set the C1 and C2 markers that define an interval. See Manage the x and y axes.