Create and configure graphs
An AC-Graph workspace can hold several graphs, each containing one or more parameters. Start with a simple plot, then adjust the layout, styling, and axes to make comparisons easier to read.
Build your first graph
A basic graph takes two actions: find a parameter and drag it onto the canvas.
1. Find the parameter
Most vehicles report hundreds of parameters, so the list is long. Scroll it, or type in the search box to narrow it down as you type. You can scroll the list horizontally to see additional columns of metadata about each signal.

Which parameters appear is determined by the config file for that vehicle, which is built in Developer.
The Parameter Count at the bottom of the list tells you how many parameters you are looking at. When the list is filtered, the first number is the filtered count and the second is the total. Once you start selecting, a third number in parentheses shows how many you have selected.
2. Drag it onto a graph
Drag the six-dot handle beside the parameter name onto the legend box of the graph you want. The data plots immediately.
A graph holds one instance of any given parameter. To plot the same parameter twice, create a second graph.
Change how a graph looks
The graph bar
The bar directly above each graph holds the controls for that graph.
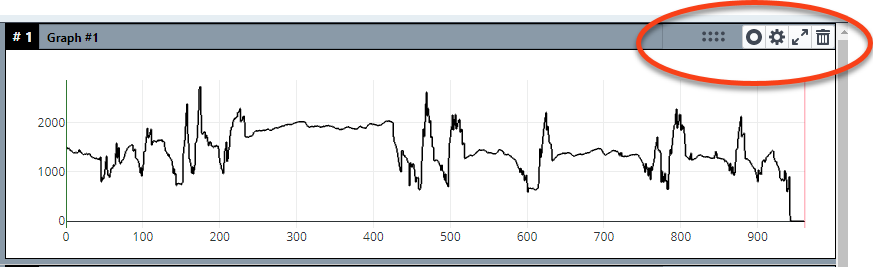
Click the title, which reads Graph #1 by default, to rename it.
| Icon | What it does |
|---|---|
| Six dots | Drag to reorder graphs on the page |
| Expand | Makes the graph larger |
| Trash | Deletes the graph |
| Gear | Opens chart properties |
| Marker | Toggles data point markers on and off |
Turning markers on gives you this:
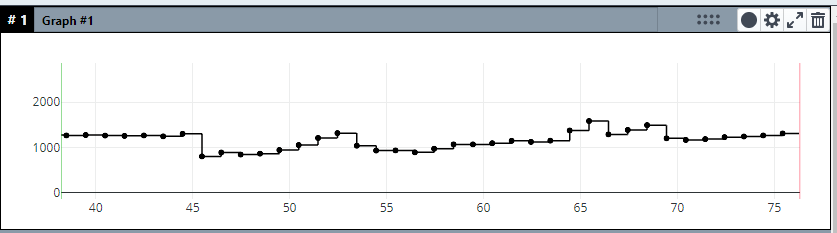
A second marker icon sits at the top of the page beside Tile graphs. That one toggles markers for every graph on the page at once.
Line and marker color
Right-click a signal name in the legend and click Edit Trace Properties.
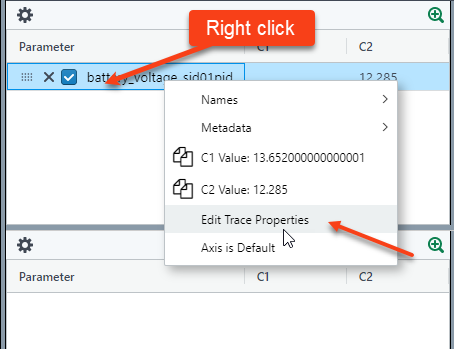
The editor has two tabs.
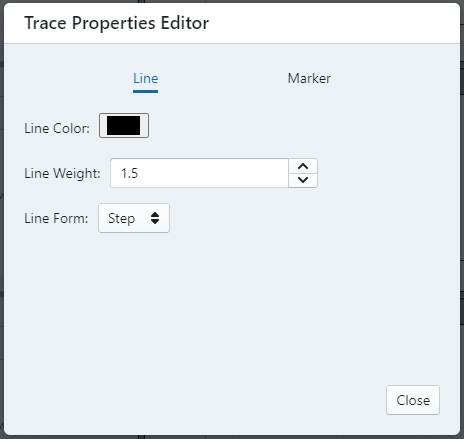
- Line sets the color, weight, and the shape of the line drawn between points.
- Marker sets the visibility, color, size, and shape of the data point markers.
Double-clicking a signal name in the legend is a shortcut for making its line bold.
Background color
-
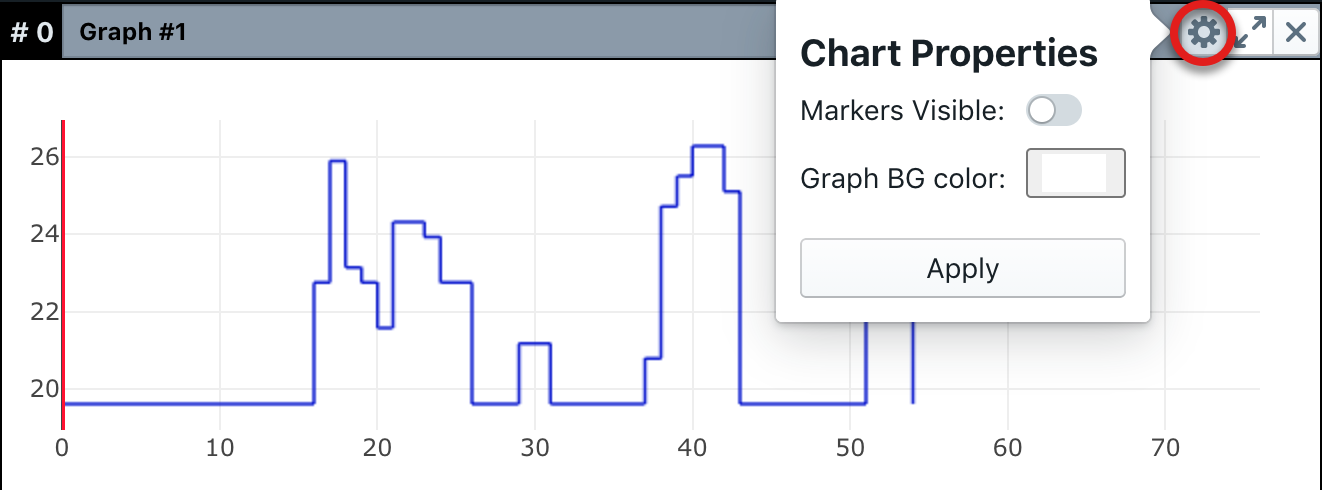
Click the gear icon in the graph bar.
-
Click the box beside Graph BG color.
-
Pick a color from the gradient, or type RGB values.
-
Click Apply.