DATALAB (legacy)
This page documents the legacy Qualifier interface. Unless a task is only available there, the User Guide covers the interface you see when you sign in.
To reach the legacy interface, set the Next-Gen UI toggle in the top bar to Off.
On this page
- Opening DATALAB
- Using DATALAB
- Filtering and adding files to an experiment
- DATALAB filters
- Managing results
- Viewing DATALAB results
- Calculating and downloading statistics
- Creating a 1D histogram
- Creating a 3D surface or bubble chart
- Performing an edge counter analysis
- Geofence filtering
Opening DATALAB
DATALAB can be opened from several places on the legacy Vehicles page. Start from the control closest to the data you already selected.
The correct DATALAB icon depends on whether the experiment will use vehicles, trips, events, or DTC files.
Files from many different vehicles
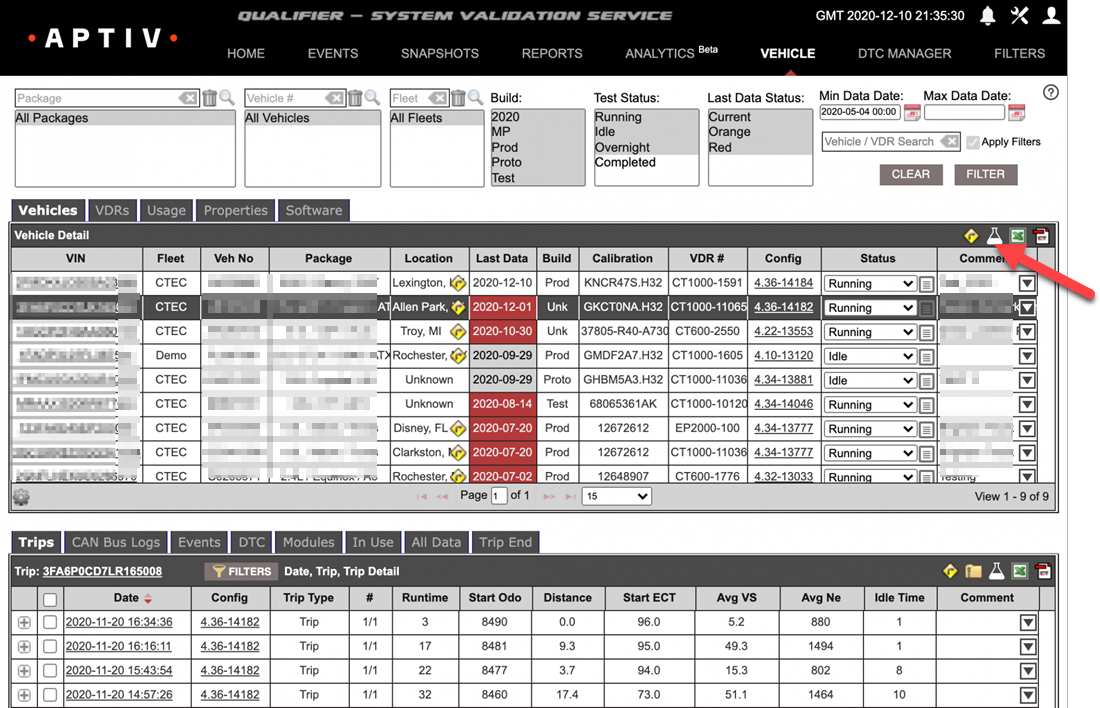
If you want to analyze files from many different vehicles, within the Vehicles (Legacy) page, click the DATALAB icon in the upper right corner of the Vehicles tab of the top table to launch the application.
Many trip files from one vehicle
To analyze several trips from one vehicle:
-
Click a vehicle row from the top table (1). This will populate the lower table with available trip files.
-
Select which files you want to add to the experiment (2).
-
Click the DATALAB icon (3) to launch the application.
Many event files from one vehicle
If you want to analyze many different event files (high- or low-speed datalogs) from one particular vehicle, follow the steps below:
-
Click a vehicle row from the top table (1). This will populate the lower table with available files.
-
Click the Events tab (2) to see which event files are available based on your current filters.
-
Select which event files you want to add to the experiment (3).
-
Click the DATALAB icon (4) to launch the application.
Many DTC-related event files from one vehicle
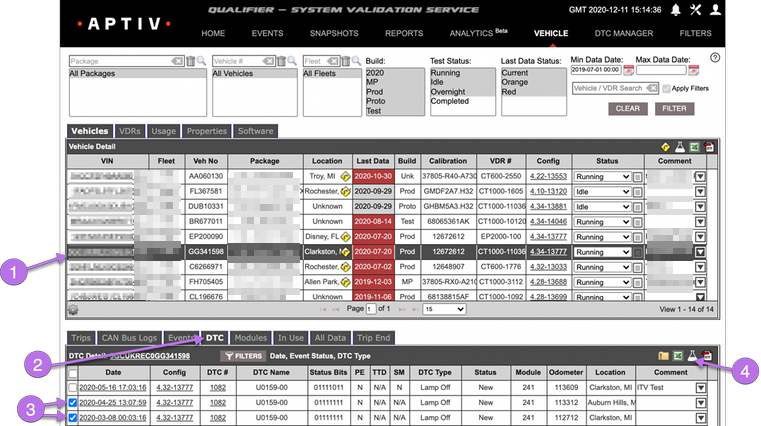
If you want to analyze many DTC-related event files from one particular vehicle, follow the steps below:
-
Click a vehicle row from the top table (1). This will populate the lower table with available files.
-
Click the DTC tab (2) to see which files are available based on your current filters.
-
Select which event files you want to add to the experiment (3)
-
Click the DATALAB icon (4) to launch the application.
Using DATALAB
DATALAB is an offline data-discovery tool for analysis beyond what is available through Snapshots, Reports, and AC-Graph.
DATALAB is only available when using the Legacy Qualifier user interface.
This page provides an overview of basic features and functionality and links to specific how-to guides.
- DATALAB highlights
- Understanding the DATALAB interface
- Action Buttons
- Source Files
- Analysis Method Selection
- File Settings or Analysis Settings
- Data Reduction
- Geofence Filtering
- Available analysis types and analyses
- Available analysis settings
- Concatenate
- Download
- 1D Histogram
- Surface and Bubble Charts
- Edge Counter
- Statistics
- Running your DATALAB experiment
- Viewing Your DATALAB Results
- Experiment result available actions
DATALAB highlights
DATALAB is especially useful if:
- You want to examine data from many different files and/or many different vehicles at once.
- You don't have an existing report template that provides the kind of information you want to see.
Important things to know about DATALAB
The following are some helpful things to know about DATALAB before you begin using the application:
- DATALAB jobs are called experiments.
- Processing an experiment can take a while, especially if it contains a large number of files. DATALAB will run in the background so that you can keep doing other Qualifier work while your experiment is processing.
- Experiments run in the order they were received. If a large experiment is ahead of yours, you may have to wait a long time (possibly hours or, in rare cases, days) before the results of your experiments will be available. We are continually working to improve speed and performance, but some jobs require
- To speed things up for everyone, we recommend you don't include any more files than necessary in your experiment and that you use parameter filtering to limit the number of parameters in your experiment.
- If your experiment is going to take a long time to process, Qualifier will give you a warning. If it is too big to process in a reasonable amount of time, Qualifier will not allow you to submit the experiment.
- When your experiment results are ready, Qualifier will send you an email and display a notification within Qualifier. You will then be able to download your results in Excel format.
Understanding the DATALAB interface
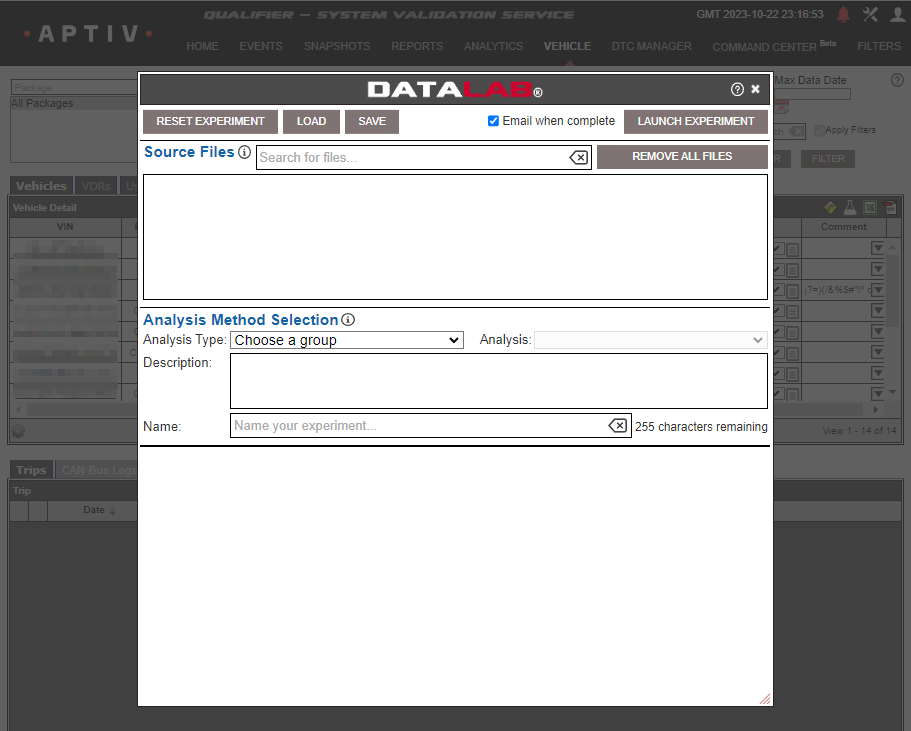
After clicking the DATALAB icon to launch the program, the DATALAB interface has several sections:
Action Buttons
At the top of the window, you will see several buttons that allow you to perform the following actions:
- Reset Experiment deletes all source files and other settings from the current experiment.
- Load allows you to loads a previously saved experiment.
- Save will save the current experiment.
- Launch Experiment runs the current experiment.
Source Files
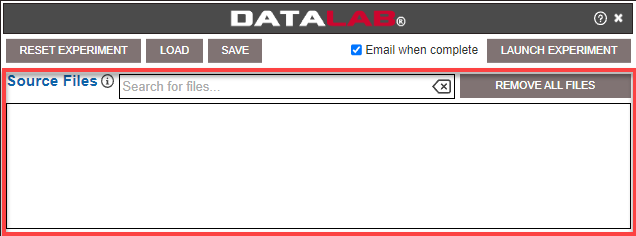
You will see all the files that you’ve added to your experiment here in Source files. If you want to delete one or more of the files you previously added to your experiment, first type some text into the search box to locate the files you want to remove, then click Remove Searched Files.
You can also remove all the files in the experiment by deleting the search text and clicking Remove All files
If you want to use one of your files as a source file for parameters, you will need to click that filename in this box.
Analysis Method Selection
This is where you will tell DATALAB what type of analysis you want to perform. Once you have chosen an Analysis Type and an Analysis, you will be shown setting options that are specific to each type.
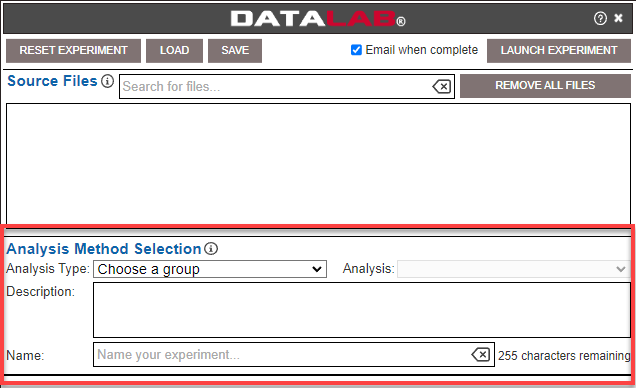
Before you can run an experiment, you must select an Analysis Type and an Analysis, and you must give your experiment a name.
File Settings or Analysis Settings
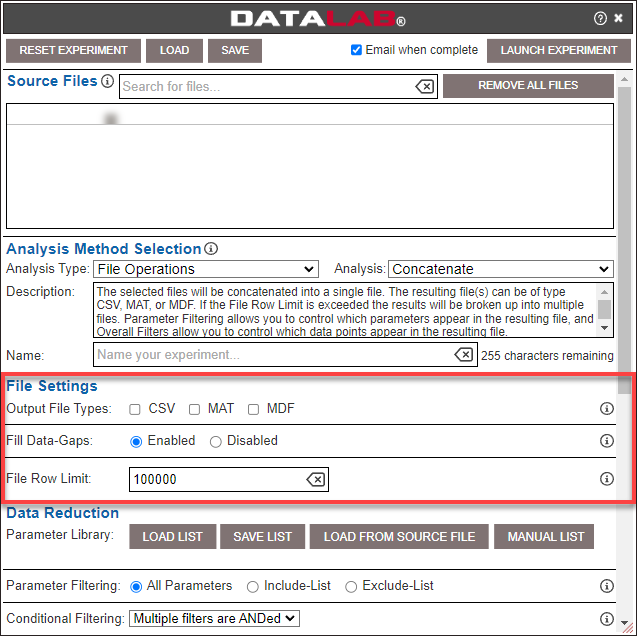
You won't see one of the settings sections until after you have selected your Analysis, and each Analysis has different settings options. See the Available Analysis Settings section below for further details on the settings for each type of analysis.
Data Reduction
This section appears only if you have selected File Operations as your Analysis Type. It allows you to filter in or out certain parameters.
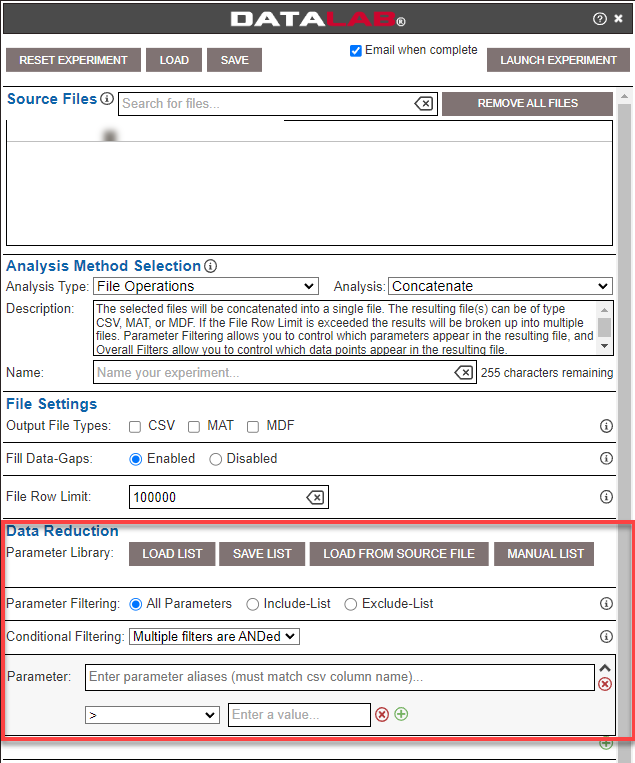
You can perform the following actions within this section:
- Enter the list of parameters manually by clicking Manual List.
- Search for and select parameters from a source file by clicking a file in the Source Files box and then clicking Load From Source File
- Use a list of parameters that you saved previously by clicking Load List. In the Parameter Filtering row, select whether you want to include all the parameters you selected or exclude all the parameters you selected. When you are done creating your parameter list, you can click Save List if you want to use this list again later for another experiment.
Conditional Filtering
This section appears for all analysis types. It allows you to filter your data so that rows get added to the experiment results only if they meet certain criteria.
For example, you can filter your data so that DATALAB analyzes only rows where the engine speed was greater than 1,000 RPM. You will need to enter the parameter name exactly as it appears in the file, but you can enter multiple names in the same box if a similar parameter has a different name in different files.
Available operators include the following:
-
greater than
-
less than
-
greater than or equal to
-
less than or equal to
-
equal
-
not equal
-
mask
-
greater than the previous value
-
less than the previous value
-
equal to the previous value
-
not equal to the previous value
-
rising edge
-
falling edge
-
rising or falling edge.
If you want to add more conditional filters, click the green plus sign. Note that you can use the drop-down list to choose whether multiple filters are joined with an AND or an OR.
Geofence Filtering
This section allows you to filter your analysis based on GPS data.
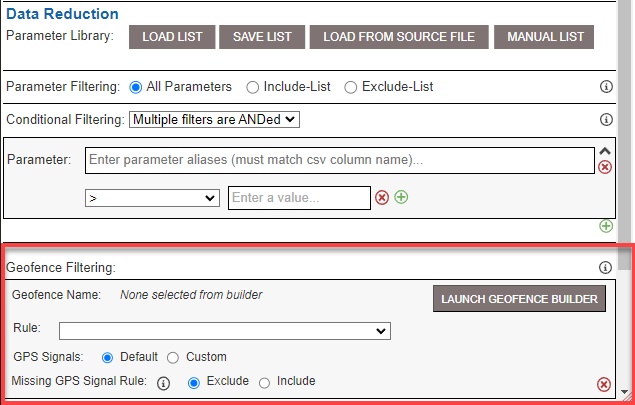
Click Launch Geofence Builder to open a window that allows you to draw a geofenced area on a map.
Available analysis types and analyses
| Analysis Type | Analysis | Description |
| File Operations | Concatenate | Joins all the selected files together into a single CSV file and downloads them to your PC. |
| Download | Downloads all the selected files as separate CSV files. | |
| Math Operations | 1D Histogram | Creates histograms (bar charts) for the parameters you select using the data from the files you added to the experiment. Each parameter you select will have its own histogram. |
| Surface | Creates 3D histograms based on two different parameters you select. | |
| Edge Counter | Counts the number of times that particular condition was true. | |
| Statistics | Calculates the minimum, maximum, average, median, standard deviation, integral, value at the start, and the value at the end for the parameters you select. | |
| Custom | Custom Analysis | Allows you to create a custom analysis using JSON. Note that this option is visible only to internal Aptiv users. |
Available analysis settings
Concatenate
This option will combine multiple files into one larger file.
Available settings options include the following:
- Output File Types: Select any of the available file types, such as CSV (Excel-compatible), MAT, or MDF. If you select more than one file type, you will receive multiple concatenated files, one for each of the file types you selected.
- Fill Data-Gaps: If your data includes null values, selecting Enabled will fill the null cells with the value immediately preceding or immediately following a group of null cells. Selecting Disabledwill leave those cells null.
- File Row Limit: Sometimes concatenated files grow too large for you to work with them easily. You can use this setting to limit the number of rows included in a single file. If DATALAB reaches the limit for a single file, it will create a second file and continue concatenating the data. It will create additional files as necessary.
Download
This option downloads the selected files without performing any other operations on them. It has only one analysis-specific option: Output File Types.
Select any of the available file types, such as CSV (Excel-compatible), MAT, or MDF.
If you select more than one file type, you will receive multiple files, one for each of the file types you selected.
1D Histogram
See How to Create a 1D Histogram in DATALAB.
Surface and Bubble Charts
See How to Create a 3D Surface Chart or Bubble Chart.
Edge Counter
See How to Perform an Edge Counter Analysis in DATALAB.
Statistics
See How to Calculate and Download Statistics in DATALAB.
Running your DATALAB experiment
After you have entered all the settings for your experiment, click the Launch Experiment button at the top of the window to run your experiment.
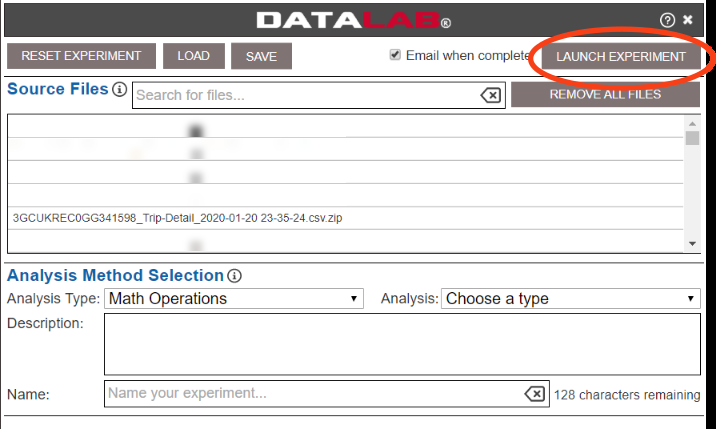
After you launch your DATALAB experiment, you will need to wait until DATALAB has finished processing the job to access your results.
Experiments are processed in the order they are received, so you may have to wait if a large experiment is ahead of yours.
Viewing Your DATALAB Results
When your experiment is ready, Qualifier will notify you in several ways. If you selected the check box that said Email when complete, you will receive an email notification. Click the download icon to download your results directly from the email.
Whether or not you receive an email, when the experiment results are ready, the Qualifier workbench icon will turn green, and Qualifier will display a green notification stating that your experiment is complete.
When you click the workbench icon, the DATALAB Results option will also be green. Click DATALAB Results to open theDATALAB Experiment Results window.
If your DATALAB results are ready, you will see your experiment listed with Complete in the Status column.
If you have the DATALAB Experiment Results window open, Qualifier will not automatically update the results when your experiment is ready. You must click the refresh icon to update the list of available experiment results.
Experiment result available actions
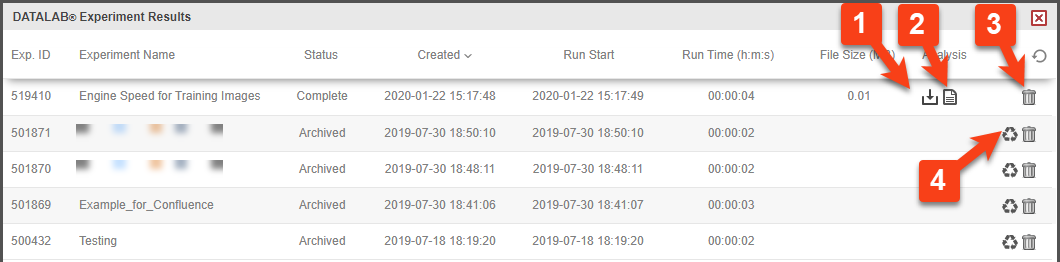
The following actions are available by clicking the appropriate icon, as shown in the screenshot below:
-
Click the download icon to download your results as an Excel file.
-
Click the log icon to download the log files for your experiment.
-
The trash can icon will delete the file.
-
If you have older experiments in your list, Qualifier may have archived them. Click the recycle icon to re-run an archived experiment.
(Not shown) If an AC-Graph icon appears, click it to open the results file in AC-Graph.
Filtering and adding files to an experiment
In order to set up a DATALAB experiment, you first need to select which files will be part of the experiment.
- Part 1: Set Filters
- Part 2: Determine which type of analysis you want to perform
- Files from Many Different Vehicles
- Filtering Trip Files
- Filtering CAN Bus Logs
- Filtering Events
- Filtering DTCs
- Filtering Charge Files
- Many Trip Files from One Vehicle
- Many Event Files from One Vehicle
- Many DTC Files from One Vehicle
- Many CAN Bus Logs from One Vehicle
- Files from Many Different Vehicles
To do so, follow the steps below:
Part 1: Set Filters
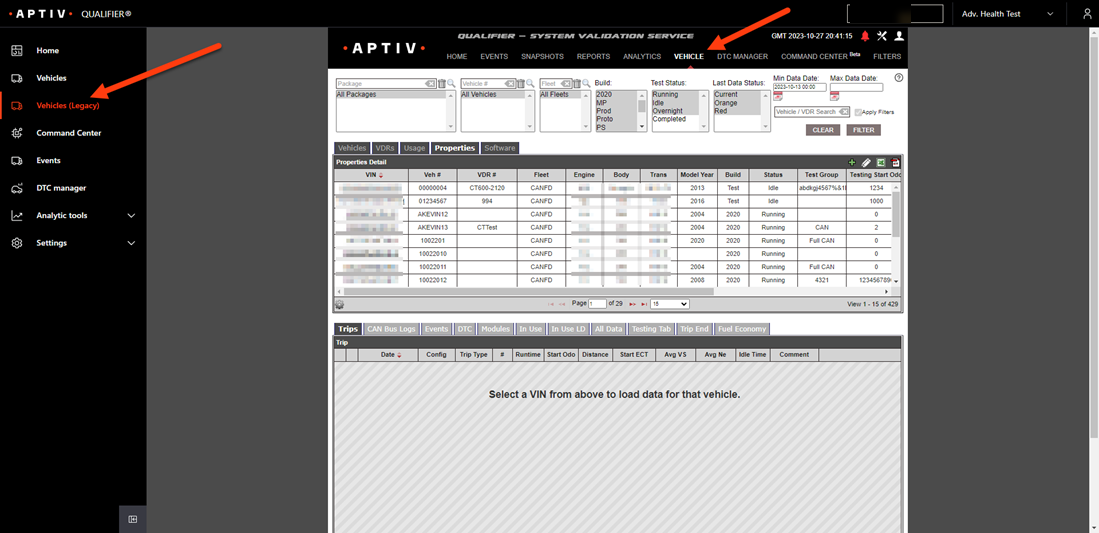
- Navigate to the Vehicles (Legacy) page using the left navigation menu in Next-Gen Qualifier. (If it loads to the Legacy Qualifier home page, click the Vehicle tab from the top navigation menu.)
-
Set the Vehicle page filters. You should start your DATALAB experiment by using the filter options at the top of the Vehicle page. You can filter by Package, Vehicle #, Fleet, Build, Test Status, Last Data Status, and Min/Max Data Date. You can also search for a particular vehicle or VDR.
-
When you are done making your selections, click the Filter.

Part 2: Determine which type of analysis you want to perform
The rest of the process for adding files to a DATALAB experiment will vary depending on what kind of files you want to use in your experiment (trip, event, or DTC files or CAN bus logs) and whether you want to analyze files from many different vehicles or from one vehicle.
The DATALAB icon appears in several different locations on the Vehicle page, and it is important that you click the correct icon for the type of analysis you want to perform. The sections below explain the process for each option in more detail.
You can perform the following analyses, which are explained in their respective sections below:
- Files from Many Different Vehicles
- Many Trip Files from One Vehicle
- Many Event Files from One Vehicle
- Many DTC Files from One Vehicle
- Many CAN Bus Logs from One Vehicle
Files from Many Different Vehicles
If you want to analyze files from many different vehicles, you should click the DATALAB icon in the upper right corner of the Vehicles tab of the top table.
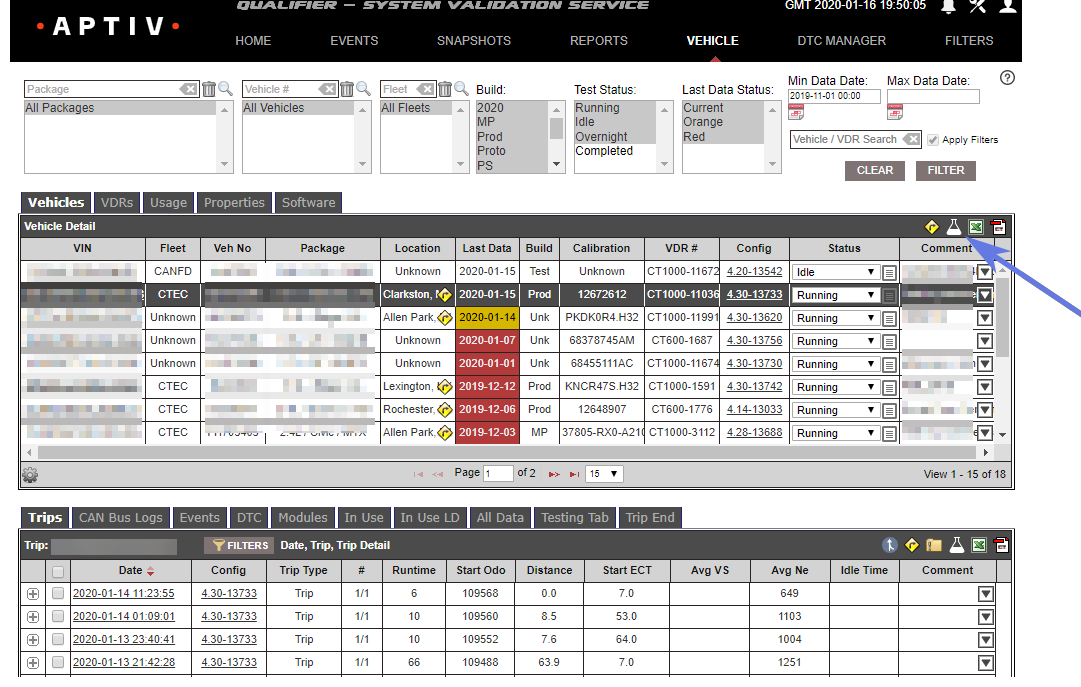
You will then see a drop-down menu. Click Select Files from Filtered Vehicles for Current Experiment.
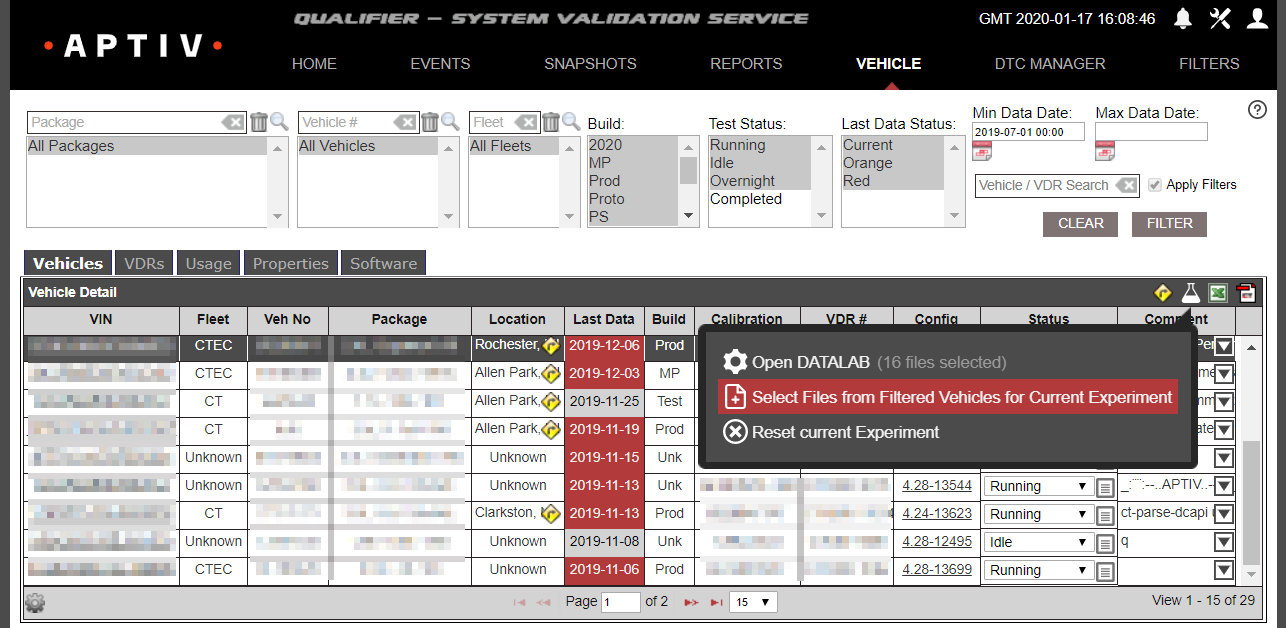
This will open a new dialog box that will give you more filtering options. Begin by choosing a File Type from the drop-down box. The filtering options you see below the File Type box will depend on which file type you select.
Options include the following:
- Filtering Trip Files
- Filtering CAN Bus Logs
- Filtering Events
- Filtering DTCs
- Filtering Charge Files
Filtering Trip Files
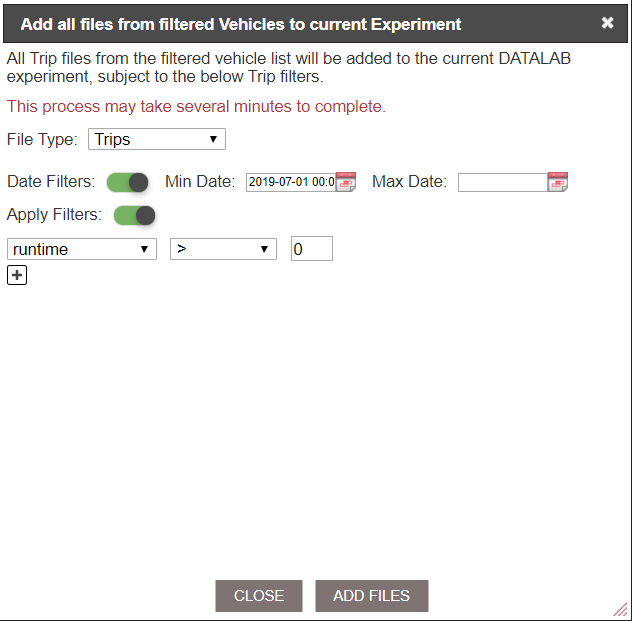
If you select Trips as your File Type, you will see Date Filtersimmediately below the File Type box. If you want to add more date filters (in addition to those you set on the Vehicle page), click the slider so that it moves to the right and turns green. Then enter the minimum and maximum dates in the appropriate boxes.
You also have the option of adding other filters. Most programs have a default conditional filter that checks to make sure the runtime was greater than zero. You can use the drop-downs to change to a different type of filter, or you can add additional filters by clicking the plus sign.
You can filter in data based on the following parameters:
-
Average engine speed
-
Average vehicle speed
-
Distance
-
Idle time
-
Runtime
-
Start engine coolant temperature
-
Start odometer
Operator options include the following:
-
greater than
-
less than
-
greater than or equal to
-
less than or equal to
-
equal
-
not equal
-
is null
-
is not null
-
is between.
When you are done setting your filters, click Add Files.
Filtering CAN Bus Logs
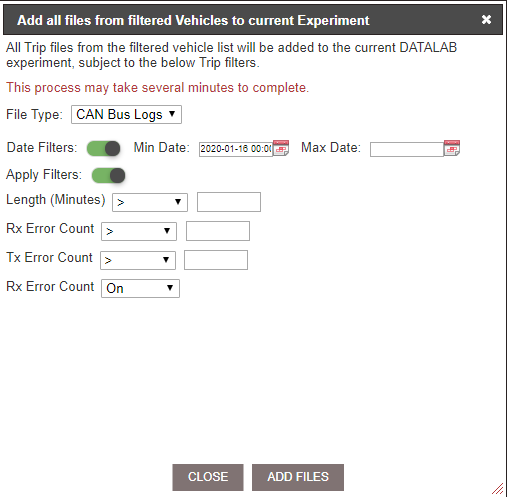
If you select CAN Bus Logsas your File Type, you will see Date Filtersimmediately below the File Type box. If you want to add more date filters (in addition to those you set on the Vehicle page), click the slider so that it moves to the right and turns green. Then enter the minimum and maximum dates in the appropriate boxes.
You also have the option of adding some other filters. You can filter in data based on
- Length (minutes)
- Rx Error Count
- Tx Error Count
Operator options include the following:
-
greater than
-
less than
-
greater than or equal to
-
less than or equal to
-
equal
-
not equal
-
is between.
You also have the following options for the Rx Error Count:
- on
- off
- on or off
When you are done setting your filters, click Add Files.
Filtering Events
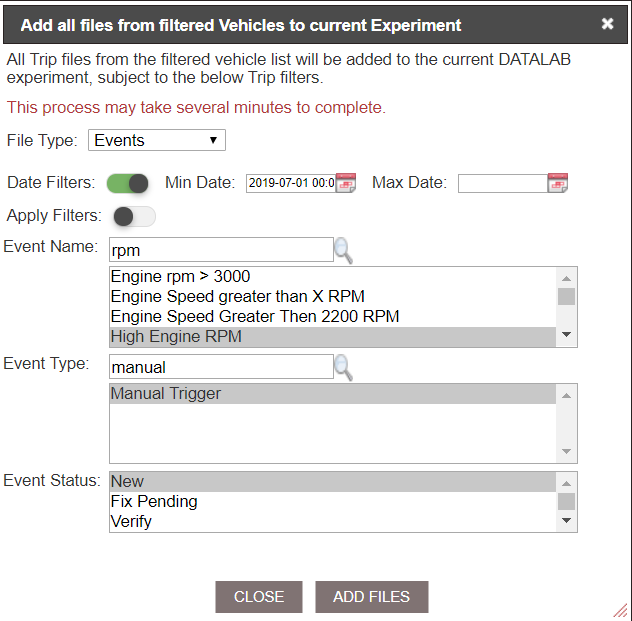
If you select Eventsas your File Type, you will see Date Filtersimmediately below the File Type box. If you want to add more date filters (in addition to those you set on the Vehicle page), click the slider so that it moves to the right and turns green. Then enter the minimum and maximum dates in the appropriate boxes.
You also have the option of adding some other filters. You can filter in data based on
- Event Name
- Event Type
- Event Status
To use these filters, first click the Apply Filters slider so that it moves to the right and turns green. Then use the search box(es) and/or drop-down list to select the desired name(s), type(s), and or status(es).
Multiple filters are ANDed.
When you are done setting your filters, click Add Files.
Filtering DTCs
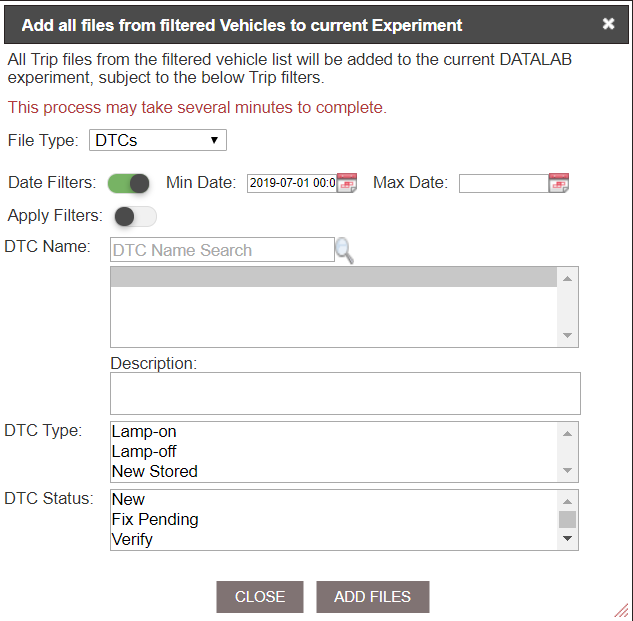
If you select DTCsas your File Type, you will see Date Filtersimmediately below the File Type box. If you want to add more date filters (in addition to those you set on the Vehicle page), click the slider so that it moves to the right and turns green. Then enter the minimum and maximum dates in the appropriate boxes.
You also have the option of adding some other filters. You can filter in data based on
- DTC Name
- DTC Type
- DTC Status
To use these filters, first click the Apply Filters slider so that it moves to the right and turns green. Then use the search box and/or drop-down list(s) to select the desired name(s), type(s), and or status(es). Note that multiple filters are ANDed.
When you are done setting your filters, click Add Files.
Filtering Charge Files
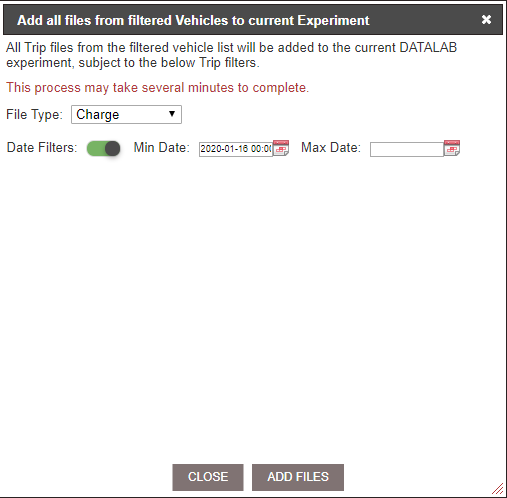
If you select Chargeas your File Type, you will see Date Filtersimmediately below the File Type box. If you want to add more date filters (in addition to those you set on the Vehicle page), click the slider so that it moves to the right and turns green. Then enter the minimum and maximum dates in the appropriate boxes.
You cannot set any other filters for charge files.
When you are done setting your filters, click Add Files.
Many Trip Files from One Vehicle
If you want to analyze a lot of trip files that are all from one particular vehicle, you will need to use the DATALAB icon on the Trips tab of the lower table.
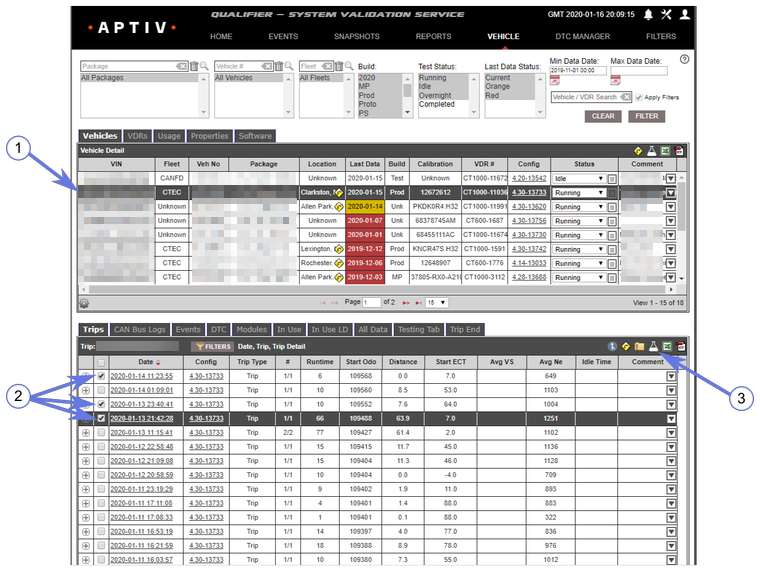
However, first you will need to click a vehicle row from the top table (1). This will populate the lower table with available trip files. (The lower table should open to the Trips tab by default. If you have another tab open, you will need to click the Trips tab.) You will need to select which files you want to add to the experiment (2) and then click the DATALAB icon (3).
Selecting trip files
You can select all the trip files that are currently visible in the lower table by clicking the select-all check box at the top of the selection column (A), as shown in the screenshot below. By default, Qualifier will show a limited number of rows per page (usually 15). If you want to select all the files on all the pages, you can use the drop-down at the bottom of the table (B) to display all the available rows on one page, and then click the select-all check box (A).
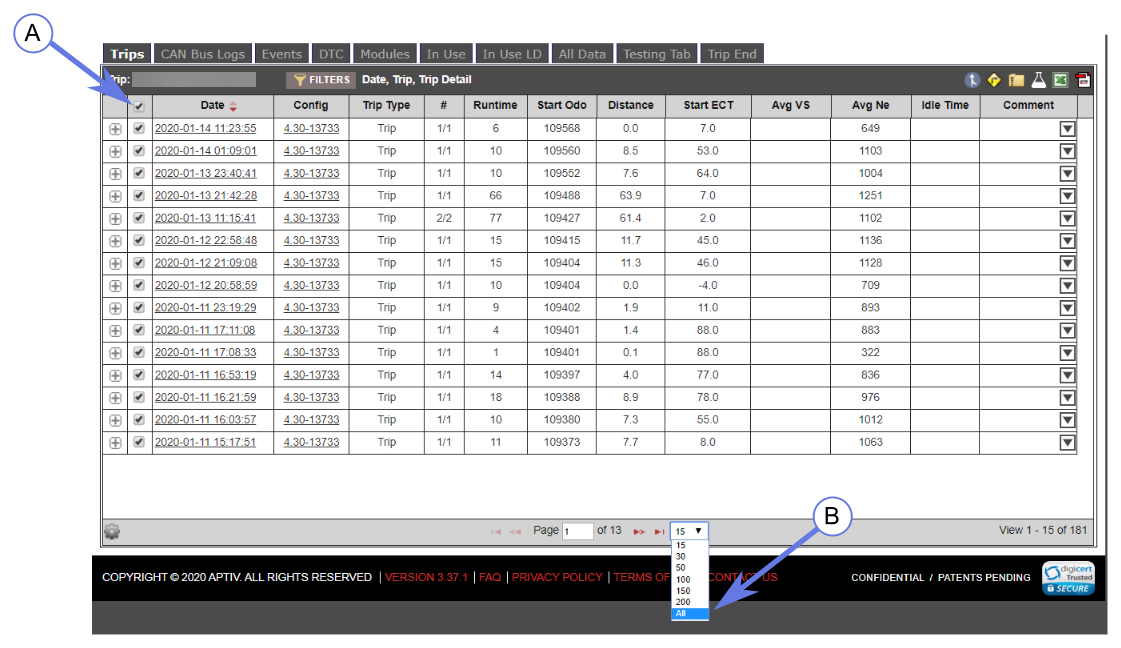
From the drop-down menu, then select Add selected files to current Experiment.
You can repeat this process as many times as you need to until you have all the desired files added to your experiment. Then click the DATALAB icon on the bottom table again, and select Open DATALAB.
Many Event Files from One Vehicle
If you want to analyze many different event files from one particular vehicle, you should click the DATALAB icon on the Events tab of the lower table.
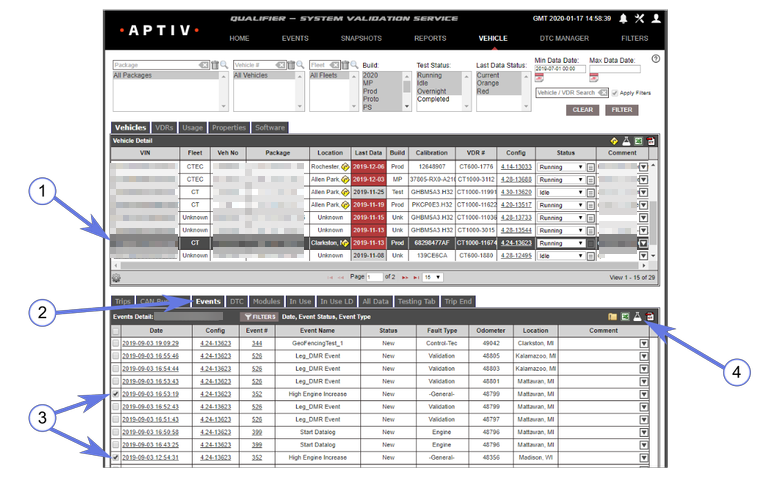
In order to do this, you will first need to click a vehicle row from the top table (1). This will populate the lower table with available files. You should then click the Events tab (2) to see which event files are available based on your current filters. You will then need to select which event files you want to add to the experiment (3) and then click the DATALAB icon (4).
From the drop-down menu, then select Add selected files to current Experiment.
You can repeat this process as many times as you need to until you have all the desired files added to your experiment. Then click the DATALAB icon on the bottom table again, and select Open DATALAB.
Many DTC Files from One Vehicle
If you want to analyze many DTC files from one particular vehicle, you should click the DATALAB icon on the DTC tab of the lower table.
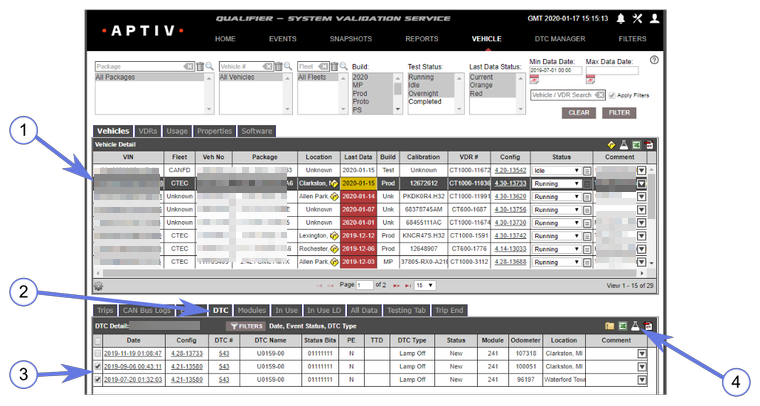
To do this, you will first need to click a vehicle row from the top table (1). This will populate the lower table with available files. You should then click the DTCtab (2) to see which files are available based on your current filters. You will then need to select which DTC files you want to add to the experiment (3) and then click the DATALAB icon (4).
From the drop-down menu, then select Add selected files to current Experiment.
You can repeat this process as many times as you need to until you have all the desired files added to your experiment. Then click the DATALAB icon on the bottom table again, and select Open DATALAB.
Many CAN Bus Logs from One Vehicle
If you want to analyze many CAN bus logs from one particular vehicle, you should click the DATALAB icon on the CAN Bus Logs tab of the lower table.
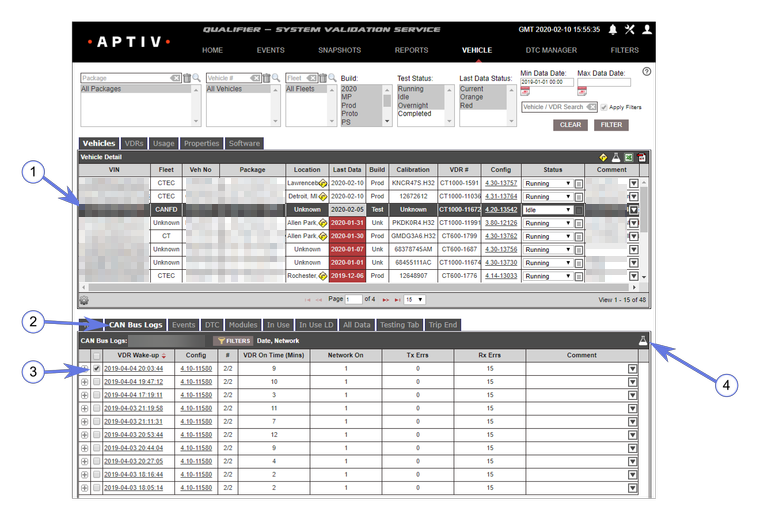
To do this, you will first need to click a vehicle row from the top table (1). This will populate the lower table with available files. You should then click the CAN Bus Logs tab (2) to see which files are available based on your current filters. You will then need to select which CAN bus logs you want to add to the experiment (3) and then click the DATALAB icon (4).
From the drop-down menu, then select Add selected files to current Experiment.
You can repeat this process as many times as you need to until you have all the desired files added to your experiment. Then click the DATALAB icon on the bottom table again, and select Open DATALAB.
DATALAB filters
As mentioned in previous sections, you should keep the number of files you add to your DATALAB experiments as low as possible.
To help you minimize the number of files you add to the experiment, Qualifier gives you several opportunities to filter your files.
Vehicle page filters
Using the filter options at the top of the Vehicles page, you can filter by the following parameters:
- Package
- Vehicle #
- Fleet
- Build
- Test Status
- Last Data Status
- Min/Max Data Date.
You can also search for a particular vehicle or VDR.

When you are done making your selections, click the Filter button.
Filtering files for multiple vehicles
Which filtering options you see next will depend on whether you want to add files for multiple vehicles or just one vehicle to your DATALAB experiment. To add files for multiple vehicles, follow the steps below:
-
Select a vehicle row.
-
With the default Vehicles tab open, click the DATALAB icon in the Vehicle Detail header row.
-
In the pop-up tab that appears, click Select Files from Filtered Vehicle for Current Experiment, as shown in the example screenshot below:
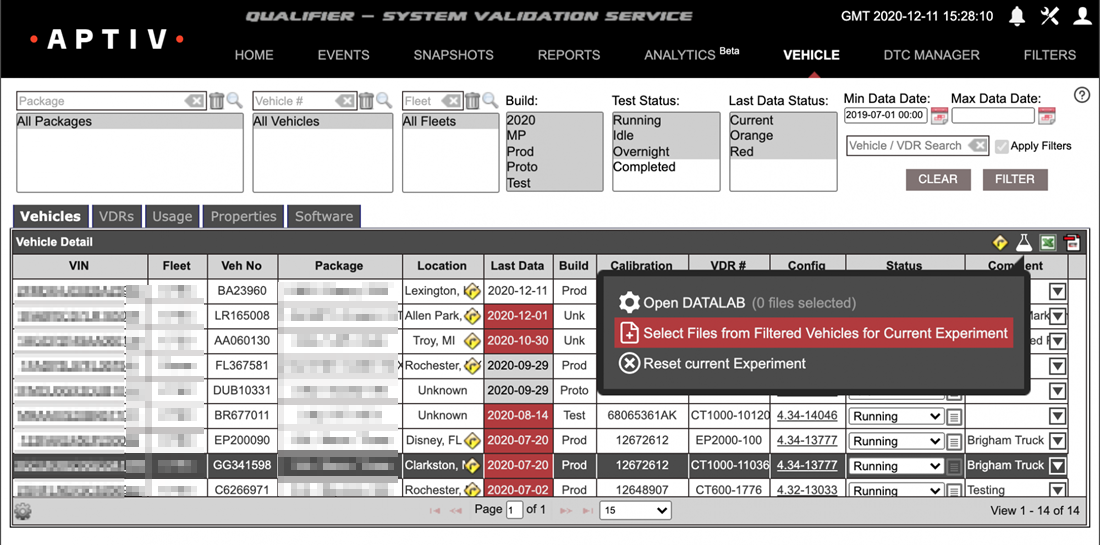
This will open a new dialog box that will give you more filtering options. Begin by choosing a File Type from the drop-down box. The filtering options you see below the file type box will depend on which type of file you select. Example screenshots for Events and DTCs are shown below:
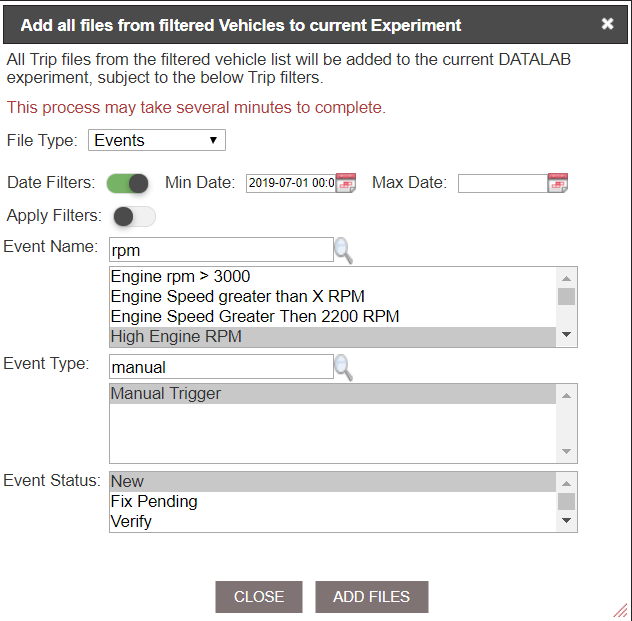
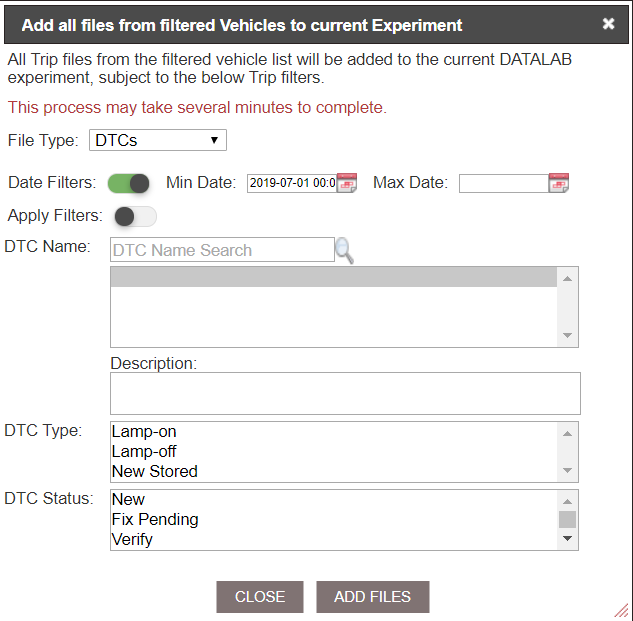
In the File Type drop-down, you will see a type of file that this tutorial hasn't previously discussed: Charge. A charge file collects 1 Hz data just like a trip file does, but it collects this data while a plug-in electric vehicle is charging rather than while the vehicle is in motion.
When you are done selecting your filter options, click Add Files.
Trips file type
When you select the Trips file type, by default DATALAB will filter out files where the runtime was less than 0 minutes (in other words, trips where the vehicle was turned on but did not go anywhere).
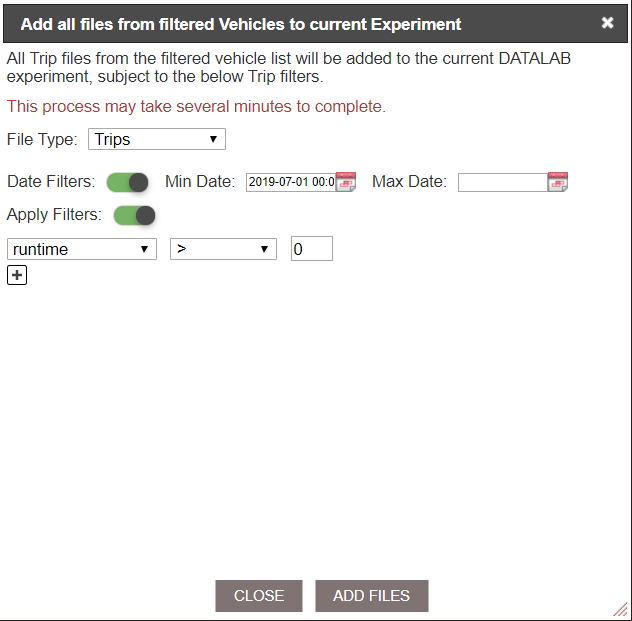
You can edit this default filter or add other filters based on average engine speed, average vehicle speed, distance, idle time, starting engine coolant temperature, or starting odometer reading.
If you want to add more conditions, click the plus icon.
If you add more filter conditions, note that DATALAB will treat them as an AND, not an OR. In other words, files will only be added if they meet all the filter conditions, not if they meet just one of them.
Filtering files for one vehicle
To add files for one vehicle, follow the steps below:
-
Select a vehicle from the top table.
-
Select each file, trip, event, or DTC tat you want to add to the experiment using the bottom table.
-
Click the DATALAB icon on the bottom table.
-
Select Add selected files to current Experiment.
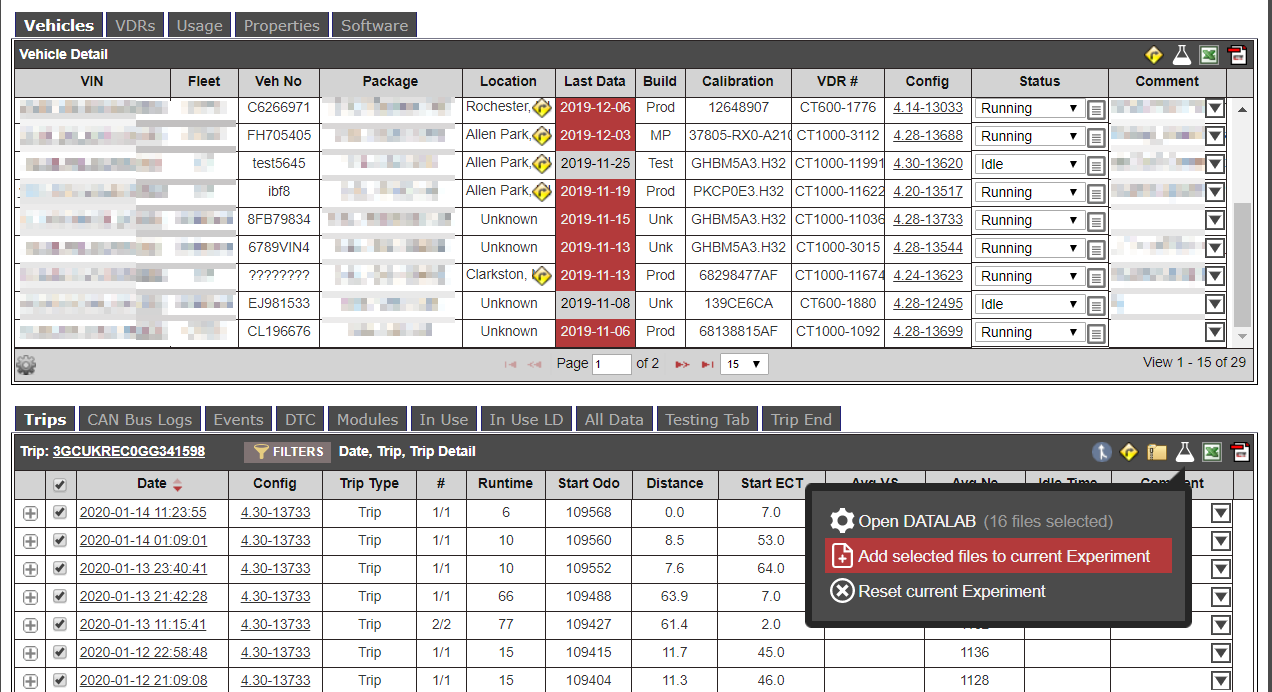
You can repeat this process as many times as you need to until you have all the desired files added to your experiment. Then click the DATALAB icon on the bottom table again, and select Open DATALAB.
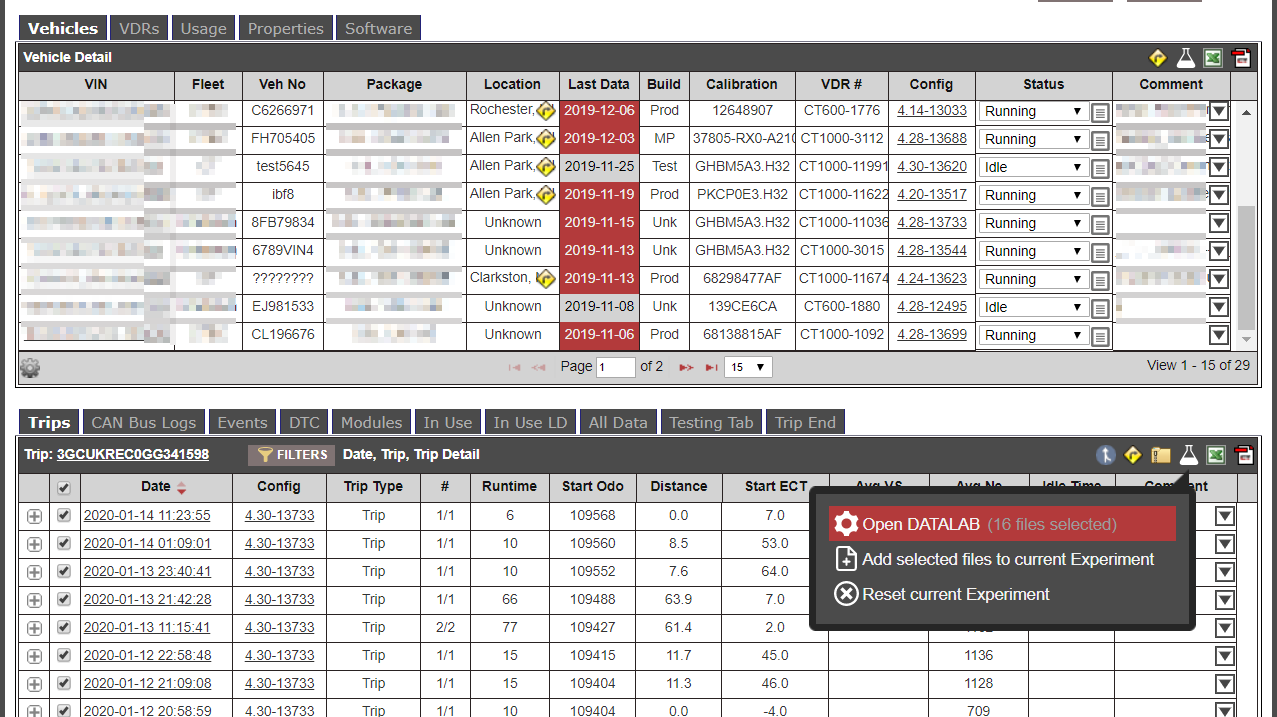
Within the DATALAB interface, you will have more opportunities to filter your data.
Managing results
After you launch your DATALAB experiment, you will need to wait until DATALAB has finished processing the job to access your results. Remember that experiments are processed in the order they are received, so you may have to wait a while if a large experiment is ahead of yours.
When your experiment is ready, Qualifier will notify you in several ways. If you selected the check box that said Email when complete, you will receive an email notification. Click the download icon to download your results directly from the email.
Whether or not you receive an email, when the experiment results are ready, the Qualifier workbench icon will turn green, and Qualifier will display a green notification stating that your experiment is complete.
When you click the workbench icon, the DATALAB Results option will also be green. Click DATALAB Results to open the DATALAB Experiment Results window. (Note that you can also open the DATALAB Experiment Results window by clicking the X on the green DATALAB Experiment Complete notification.)
If your DATALAB results are ready, you will see your experiment listed with Complete in the Status column. Click the download icon to download your results as an Excel file. Click the log icon to download the log files for your experiment. The trash can icon will delete the file.
If you have older experiments in your list, Qualifier may have archived them. Click the recycle icon to re-run an archived experiment. If you see an AC-Graph icon , you may click it to open your results file in AC-Graph.
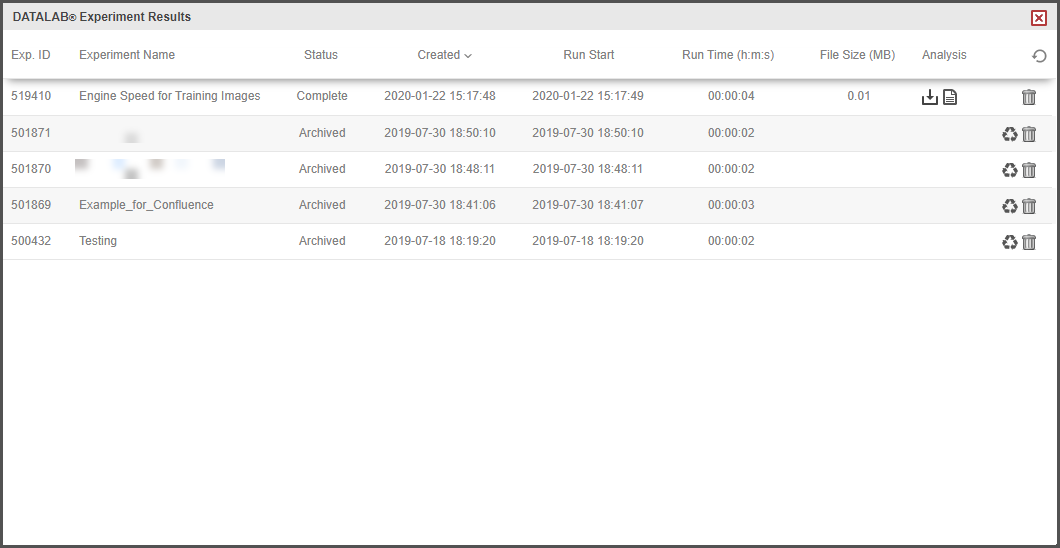
If you have the DATALAB Experiment Results window open, Qualifier will not automatically update the results when your experiment is ready. You must click the refresh icon to update the list of available experiment results.
Viewing DATALAB results
The most popular option for viewing DATALAB Results is as a CSV file that you can open in Excel.
For File Operations (Download or Concatenate), you will have an Excel file (or group of Excel files) with just one tab. For Math Operations, you will receive a file (or group of files) with several tabs: a Summary tab, an Aggregates tab, and a number of other detail tabs that will vary depending on which files you added to your experiment.
The Summary tab contains an overview of the settings you selected for your experiment.
The Aggregates tab contains the experiment results, including histograms and statistics. You can work with the data and charts as you would in another Excel workbook.

Congratulations, you’ve now completed the Introduction to DATALAB Tutorial!
Calculating and downloading statistics
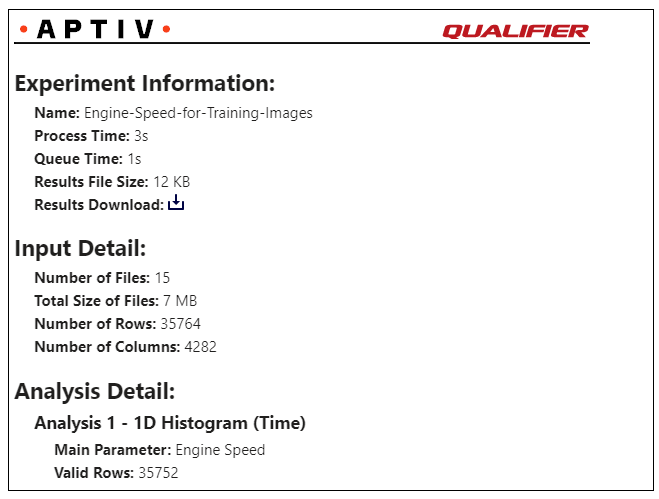
If you select Statistics in the Analysis drop-down list, DATALAB will calculate statistics on the parameter(s) you select and deliver them in Excel-compatible format that looks something like the following screenshot:
If you choose the Statistics option, you will see an Analysis Settings section. This section allows you to load the parameters that you will use to calculate your statistics, and appears as shown below:
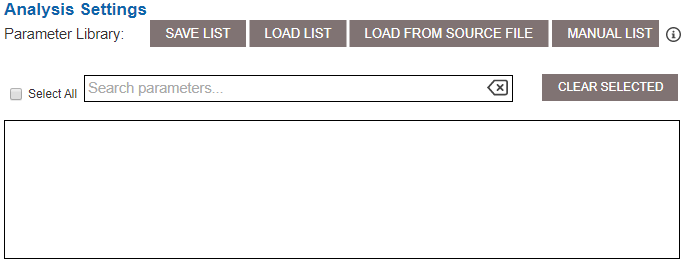
You have three different options for loading parameters:
- Type the parameters manually.
- Load parameters from a source file.
- Load a saved list.
Type the parameters manually
To use this option, click the Manual List button. In the pop-up window, type the parameters that you would like to have available for your histogram. Note that you must type the parameter name exactly as it appears in the file, and you should separate multiple parameters with a comma.

When you are done typing the parameters, click Submit. If you would like to save your list, click Save List. Then move on to the Histograms settings below.
Load parameters from a source file
If you aren't sure of the exact names for your parameters, but you know that they exist in one of the files in your experiment, you should first scroll back up to the top of the DATALAB interface to the Source Files section.
Either scroll down or use the search box to find the file you want to use as the source file, and click the filename. DATALAB will highlight it in red, as show in the following screenshot:
Next, scroll back down to the Analysis Settings section and click the Load From Source File button.
This will bring up a list of available parameters. Scroll or use the search box to find the parameters you would like to have available and select the check boxes next to them. When you are finished selecting parameters, click Save Listif you would like to save your list. Then move on to the Histograms settings below.
Load a saved list
If you have previously saved a list that you typed manually or loaded from a source file, click Load List. In the pop-up window, you will see a the available lists. Select one and click Load. Then move on to the Histogramssettings below.
Statistics settings options
The Statistics settings options are shown in the following screenshot and described below:
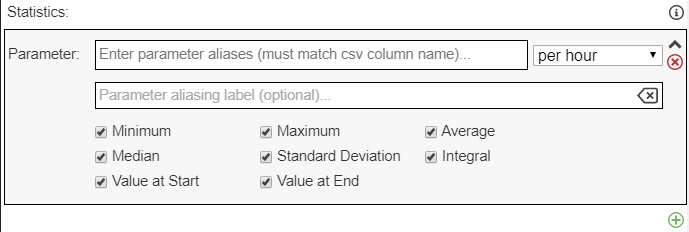
Parameter
Enter the name of the parameter(s) for your statistical analysis. As you begin typing, you will see a drop-down list with available parameters. (DATALAB takes the list of available parameters from the file you clicked in the Source Files box near the top of the window.) If the parameter value has a different name in different files (e.g., one file might have an eng_rpm parameter, while another has an eng_spd parameter), you should enter all the different names, one at a time.
To the right of the Parameter box, you will also have to select units from the drop-down list.
The available options are per millisecond, per second, per minute, or per hour.
Parameter aliasing label (optional)
If you want to specify a label for your statistics, you should enter it here. If you enter nothing, DATALAB will use the name of the first parameter that you entered in the box above as the label.
Statistics
Select the types of statistics you would like DATALAB to calculate for this parameter. You must select at least one, and you can select as many different options as you like. Each type of statistic will appear in a separate column in your CSV file.
The available options are Minimum, Maximum, Average, Median, Standard Deviation, Integral, Value at Start, and Value at End.
Green Plus Icon
If you want to add statistics for another parameter to your analysis, click the green plus button below the settings box.
Creating a 1D histogram
One of the DATALAB analysis option is to create a 1D histogram.
This option will create a histogram (similar to a bar chart) that looks something like the following screenshot:
If you choose the 1D Histogram option, you will see an Analysis Settings section. This section allows you to load the parameters that you will use to create your histogram.
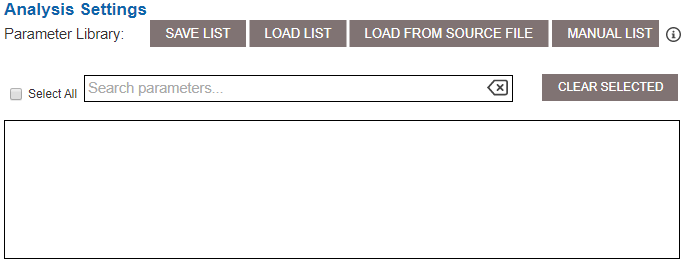
You have three different options for loading parameters:
- Type the parameters manually.
- Load parameters from a source file.
- Load a saved list.
Type the parameters manually
To use this option, click the Manual List button. In the pop-up window, type the parameters that you would like to have available for your histogram. Note that you must type the parameter name exactly as it appears in the file, and you should separate multiple parameters with a comma.
When you are done typing the parameters, click Submit. If you would like to save your list, click Save List. Then move on to the Histograms settings below.
Load parameters from a source file
If you aren't sure of the exact names for your parameters, but you know that they exist in one of the files in your experiment, you should first scroll back up to the top of the DATALAB interface to the Source Files section.
Either scroll down or use the search box to find the file you want to use as the source file, and click the filename. DATALAB will highlight it in red, as show in the following screenshot:
Next, scroll back down to the Analysis Settings section and click the Load From Source File button.
This will bring up a list of available parameters. Scroll or use the search box to find the parameters you would like to have available and select the check boxes next to them. When you are finished selecting parameters, click Save Listif you would like to save your list. Then move on to the Histograms settings below.
Load a saved list
If you have previously saved a list that you typed manually or loaded from a source file, click Load List. In the pop-up window, you will see a the available lists. Select one and click Load. Then move on to the Histogramssettings below.
Histograms settings options
Below the Analysis Settings section is the Histograms settings panel. The Histogram settings panel will look slightly different depending on which type of histogram you select. If you select Time (Basis=1) or Sample (Basis=0), you will see an interface like the following:
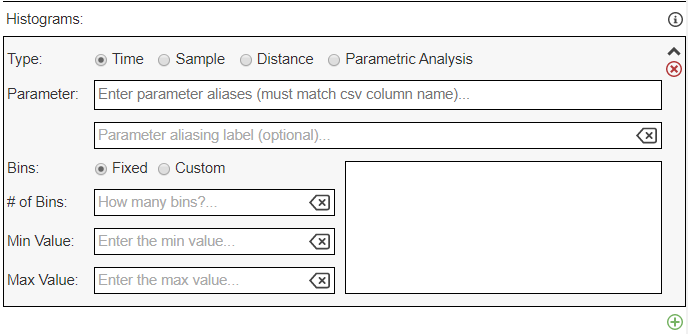
If you select Distance (Basis=2), you will see a slightly different interface that looks like this:
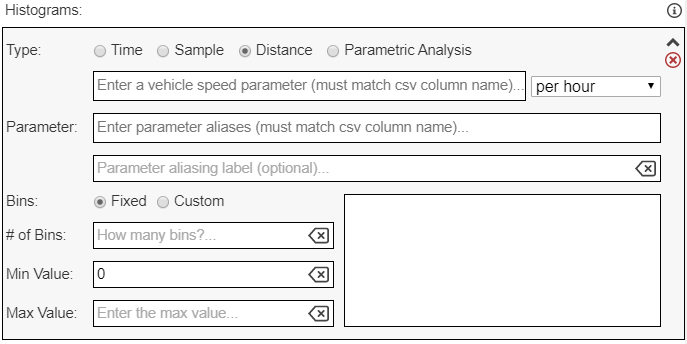
And if you select Parametric Analysis (Basis=3), you will see this:
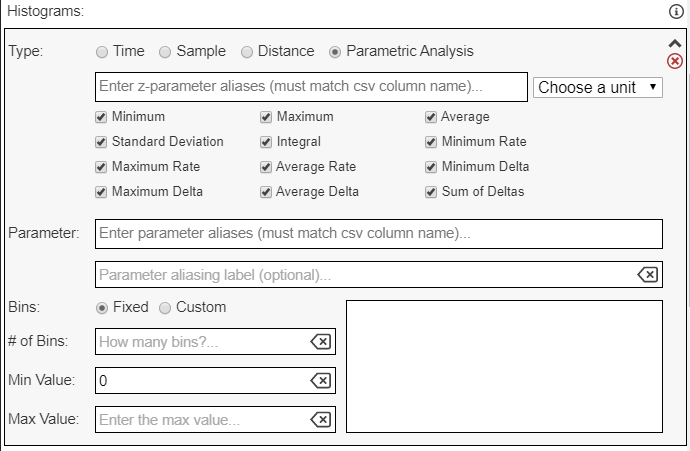
Your available options are described below:
- Type
- Enter a vehicle speed parameter (Distance only)
- Enter z-parameter aliases (Parametric Analysis only)
- Parameter
- Parameter aliasing label (optional)
- Bins
-
of Bins
- Min Value (fixed bins only)
- Max Value (fixed bins only)
- Green Plus Icon
Type
Your histogram type determines what values will go on the y-axis of your histogram. A Time histogram will show you the amount of time the vehicle spent in each of the bins. A Sample histogram will show you what percent of the total data fell into each of the bins. A Distance histogram will show you how far the vehicle traveled while in one of the bins. And a Parametric Analysis histogram allows you to use a second parameter as the y-axis value.
Enter a vehicle speed parameter (Distance only)
If you select Distanceas your histogram type, you must select a speed parameter to use as the y-axis for the histogram. As you begin typing, you will see a drop-down list with available parameters. (DATALAB will get the available parameter names from whichever file you clicked in the Source Files box near the top of the window.) In the drop-down box to the left, you will also need to specify whether the speed was measured per millisecond, per second, per minute, or per hour. This will allow DATALAB to use the speed parameter to calculate the distance traveled.
Enter z-parameter aliases (Parametric Analysis only)
If you select Parametric Analysis as your histogram type, you will need to select a second parameter for your analysis. As you begin typing, you will see a drop-down list with available parameters. You will also need to choose a unit (per millisecond, per second, per minute, or per hour), and you will need to select at least one of the statistical analysis options (Minimum, Maximum, Average, etc.) from the columns below the Enter z-parameter aliases box. If you select more than one of the types of statistical analysis, DATALAB will create multiple histograms.
Parameter
Enter the name of the parameter(s) that you want to create the histogram for. As you begin typing, you will see a drop-down list with available parameters. If the parameter has a different name in different files (e.g., one file might have an eng_rpm parameter, while another has an eng_spd parameter), you should enter all the different names, one at a time.
Parameter aliasing label (optional)
If you want to specify the label that will appear on the x-axis of your histogram, you should enter it here. If you enter nothing, DATALAB will use the name of the first parameter that you entered in the box above as the label.
Bins
You have two options for the type of bins: Fixed (the bins are evenly spaced between the minimum and maximum value) or Custom (you set up the size of each bin manually). If you select Custom, the bins do not have to be evenly spaced. However, you will need to enter the values for the bins in the box on the right side of the window, as shown in the screenshot below:
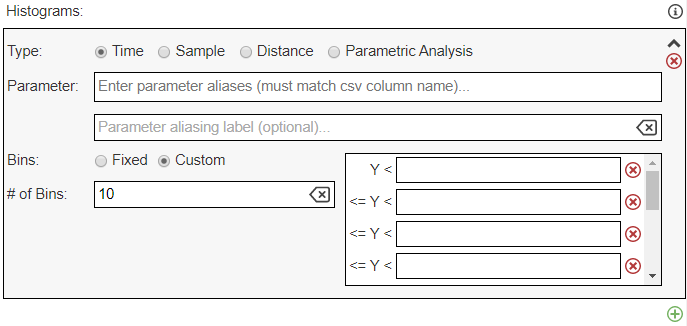
# of Bins
Enter the number of bins (bars) you would like to see on your histogram. See note below.
When entering the number of bins you would like to have in your histogram, you should add 2 to the number of bins that you actually want. DATALAB automatically creates a bin for values that are below your minimum and a bin for values that are above the maximum. So if you wanted to have 10 bins equally spaced between 1 and 100, you should actually type 12 in the # of Bins box. DATALAB will then create a histogram with a bin for values less than 1, a bin for values greater than 100, a bin for 1–10, a bin for 11–20, etc.
Min Value (fixed bins only)
The lowest value you would like to have included in your bins. (Note, however, that DATALAB will put any values below this minimum value in a separate bin.)
Max Value (fixed bins only)
The highest value you would like to have included in your bins. (Note, however, that DATALAB will put any values above this maximum value in a separate bin.)
Green Plus Icon
If you want to add another histogram to your analysis, click the green plus button below the settings box.
Creating a 3D surface or bubble chart
One of the DATALAB analysis option is to create a 3D surface chart or bubble chart.
This option will either create a 3D surface chart that looks something like the following screenshot:
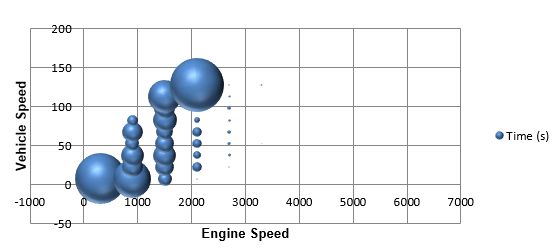
Or, it will create a bubble chart that will look something like the following screenshot:
If you choose the Surface option, you will see an Analysis Settings section. This section allows you to load the parameters that you will use to create your surface chart or bubble chart, as shown in the screenshot below:
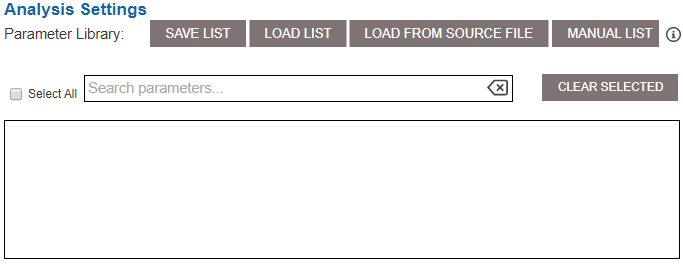
You have three different options for loading parameters:
- Type the parameters manually.
- Load parameters from a source file.
- Load a saved list.
Type the parameters manually
To use this option, click the Manual List button. In the pop-up window, type the parameters that you would like to have available for your histogram. Note that you must type the parameter name exactly as it appears in the file, and you should separate multiple parameters with a comma.
When you are done typing the parameters, click Submit. If you would like to save your list, click Save List. Then move on to the Histograms settings below.
Load parameters from a source file
If you aren't sure of the exact names for your parameters, but you know that they exist in one of the files in your experiment, you should first scroll back up to the top of the DATALAB interface to the Source Files section.
Either scroll down or use the search box to find the file you want to use as the source file, and click the filename. DATALAB will highlight it in red, as show in the following screenshot:
Next, scroll back down to the Analysis Settings section and click the Load From Source File button.
This will bring up a list of available parameters. Scroll or use the search box to find the parameters you would like to have available and select the check boxes next to them. When you are finished selecting parameters, click Save Listif you would like to save your list. Then move on to the Histograms settings below.
Load a saved list
If you have previously saved a list that you typed manually or loaded from a source file, click Load List. In the pop-up window, you will see a the available lists. Select one and click Load. Then move on to the Histogramssettings below.
Surfaces setting options
The interface for the Surfaces analysis is very similar to the interface for 1D Histograms, except that you will need to enter two parameters instead of just one, as shown in the example screenshot below:
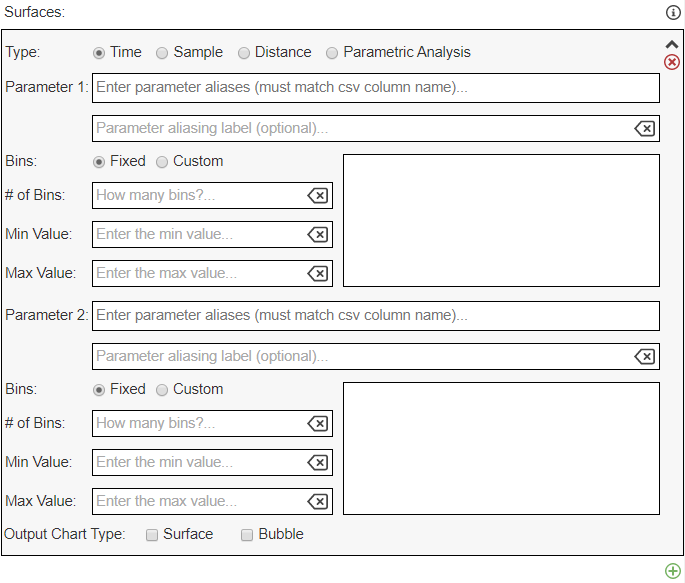
Your available options are described below:
- Type
- Enter a vehicle speed parameter (Distance only)
- Enter z-parameter aliases (Parametric Analysis only)
- Parameter 1/Parameter 2
- Parameter aliasing label (optional)
- Bins
-
of Bins
- Min Value (fixed bins only)
- Max Value (fixed bins only)
- Output Chart Type
- Green Plus Icon
Type
Your surface type determines what values will go on the y-axis of your surface. A Time surface will show you the amount of time the vehicle spent in each of the bins. A Sample surface will show you what percent of the total data fell into each of the bins. A Distance surface will show you how far the vehicle traveled while in one of the bins. And a Parametric Analysis surface allows you to use a second parameter as the y-axis value.
Enter a vehicle speed parameter (Distance only)
If you select Distanceas your surface type, you must select a speed parameter to use as the y-axis for the surface. As you begin typing, you will see a drop-down list with available parameters. (DATALAB will get the available parameter names from whichever file you clicked in the Source Files box near the top of the window.) In the drop-down box to the left, you will also need to specify whether the speed was measured per millisecond, per second, per minute, or per hour. This will allow DATALAB to use the speed parameter to calculate the distance traveled.
Enter z-parameter aliases (Parametric Analysis only)
If you select Parametric Analysis as your surface type, you will need to select an additional parameter for your analysis. As you begin typing, you will see a drop-down list with available parameters. You will also need to choose a unit (per millisecond, per second, per minute, or per hour), and you will need to select at least one of the statistical analysis options (Minimum, Maximum, Average, etc.) from the columns below the Enter z-parameter aliases box. If you select more than one of the types of statistical analysis, DATALAB will create multiple surfaces.
Parameter 1/Parameter 2
Enter the name of the parameters that you want to use in your surface. As you begin typing, you will see a drop-down list with available parameters. If the parameter value has a different name in different files (e.g., one file might have an eng_rpm parameter, while another has an eng_spd parameter), you should enter all the different names, one at a time. Note that you will have the same options regarding labels and bins for both the first and second parameter.
Parameter aliasing label (optional)
If you want to specify the labels that will appear on the x- and z-axes of your surface, you should enter them in these boxes. If you enter nothing, DATALAB will use the names of the first parameter that you entered in the boxes above as the label.
Bins
You have two options for the type of bins: Fixed (the bins are evenly spaced between the minimum and maximum value) or Custom (you set up the size of each bin manually). If you select Custom, the bins do not have to be evenly spaced. However, you will need to enter the values for the bins in the box on the right side of the window.
# of Bins
Enter the number of bins you would like to see on your surface. See note below.
When entering the number of bins you would like to have in your surface, you should add 2 to the number of bins that you actually want. DATALAB automatically creates a bin for values that are below your minimum and a bin for values that are above the maximum. So if you wanted to have 10 bins equally spaced between 1 and 100, you should actually type 12 in the # of Bins box. DATALAB will then create a surface with a bin for values less than 1, a bin for values greater than 100, a bin for 1–10, a bin for 11–20, etc.
Min Value (fixed bins only)
The lowest value you would like to have included in your bins. (Note, however, that DATALAB will put any values below this minimum value in a separate bin.)
Max Value (fixed bins only)
The highest value you would like to have included in your bins. (Note, however, that DATALAB will put any values above this maximum value in a separate bin.)
Output Chart Type
Select Surface or Bubble, depending on which type of surface you would like to generate. (See images above.)
Green Plus Icon
If you want to add another surface to your analysis, click the green plus button below the settings box.
Performing an edge counter analysis
In some situations, you may want a count of how often a particular event occurred.
For example, you could count how often the driver pressed the brakes or how often the automatic stop/start system cycled off and on.
If you select the Edge Counter analysis, DATALAB will provide an Excel-compatible file with a count of events, similar to the following screenshot:
If you choose the Edge Counter option, you will see an Analysis Settings section. This section allows you to load the parameters that you will use for your edge counter. The following is an example screenshot:
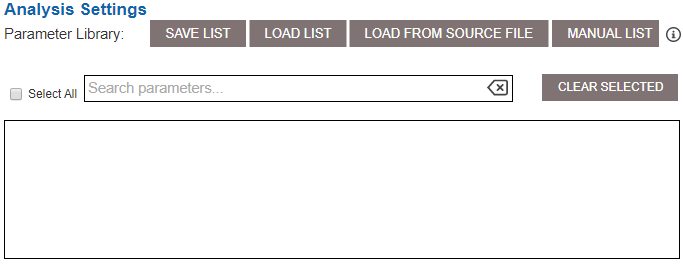
You have three different options for loading parameters:
- Type the parameters manually.
- Load parameters from a source file.
- Load a saved list.
Type the parameters manually
To use this option, click the Manual List button. In the pop-up window, type the parameters that you would like to have available for your histogram. Note that you must type the parameter name exactly as it appears in the file, and you should separate multiple parameters with a comma.
When you are done typing the parameters, click Submit. If you would like to save your list, click Save List. Then move on to the Histograms settings below.
Load parameters from a source file
If you aren't sure of the exact names for your parameters, but you know that they exist in one of the files in your experiment, you should first scroll back up to the top of the DATALAB interface to the Source Files section.
Either scroll down or use the search box to find the file you want to use as the source file, and click the filename. DATALAB will highlight it in red, as show in the following screenshot:
Next, scroll back down to the Analysis Settings section and click the Load From Source File button.
This will bring up a list of available parameters. Scroll or use the search box to find the parameters you would like to have available and select the check boxes next to them. When you are finished selecting parameters, click Save Listif you would like to save your list. Then move on to the Histograms settings below.
Load a saved list
If you have previously saved a list that you typed manually or loaded from a source file, click Load List. In the pop-up window, you will see a the available lists. Select one and click Load. Then move on to the Histogramssettings below.
Edge counters settings options
Your available Edge Counters options, shown in the following screenshot, are described below:
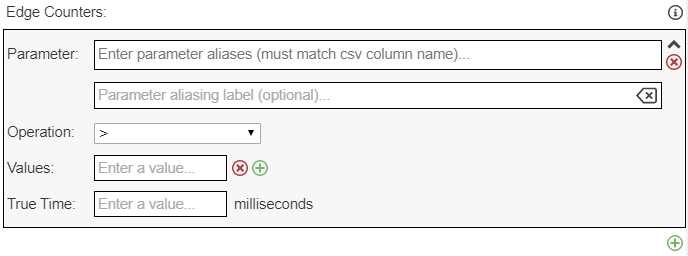
- Parameter
- Parameter aliasing label (optional)
- Operation
- Value
- True Time
- Green Plus Icon
Parameter
Enter the name of the parameter(s) that you want to count. As you begin typing, you will see a drop-down list with available parameters. (DATALAB takes the list of available parameters from the file you clicked in the Source Files box near the top of the window.) If the parameter value has a different name in different files (e.g., one file might have an eng_rpm parameter, while another has an eng_spd parameter), you should enter all the different names, one at a time.
Parameter aliasing label (optional)
If you want to specify a label for your edge counter, you should enter it here. If you enter nothing, DATALAB will use the name of the first parameter that you entered in the box above as the label.
Operation
Select the operation DATALAB should use to trigger the edge counter. Your options are greater than, less than, greater than or equal to, less than or equal to, equal to, not equal to, rising or falling edge, rising edge, or falling edge,
Value
Type the value that DATALAB should compare the parameter to in order to trigger the counter. For example, if you have a parameter that can be 0 or 1 (on or off), you can type 0.5 in this box to count each time that the parameter switches from 0 to 1. Note that you can add more values by clicking the green plus sign .
True Time
You may or may not see this option, depending on the type of operation you pick. If you see this box, you will need to enter a time to serve as a second condition for your trigger. Your trigger must be true for at least the number of milliseconds you enter in this box in order for DATALAB to count it in the analysis.
For example, if you set an edge counter to trigger when the vehicle speed is greater than 55 and you enter 100 in the True Time box, DATALAB will only count instances where the vehicle speed is greater than 55 for at least 100 milliseconds. It would not count another instance until the vehicle speed dropped below 55 (for any period of time) and then went back above 55 for at least 100 milliseconds.
Green Plus Icon
If you want to add another edge counter to your analysis, click the green plus button below the settings box.
Geofence filtering
The Geofence Filteringsection of DATALAB allows you to include or exclude data from your analysis based on vehicle location.
To use geofence filtering, follow the steps below:
- Click the Launch Geofence Builder button, which will open the following window:
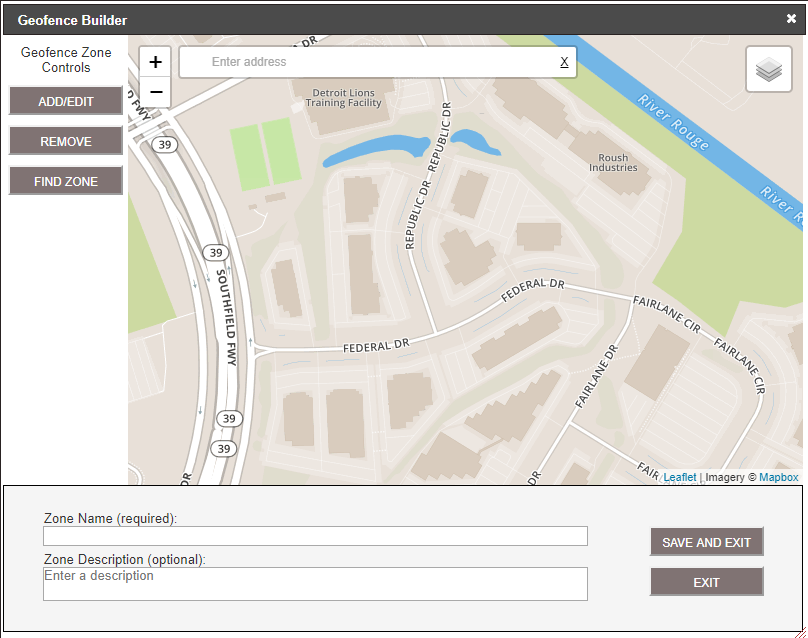
-
If the map isn't currently showing the area where you would like to create the geofence, type an address in the box that says Enter address. Alternatively, you can also click and drag the map to move to a different location.
-
When the map is positioned over the area that you would like to geofence, click the Add/Edit button. This will put a red shaded box on top of the map, as shown in the screenshot below:
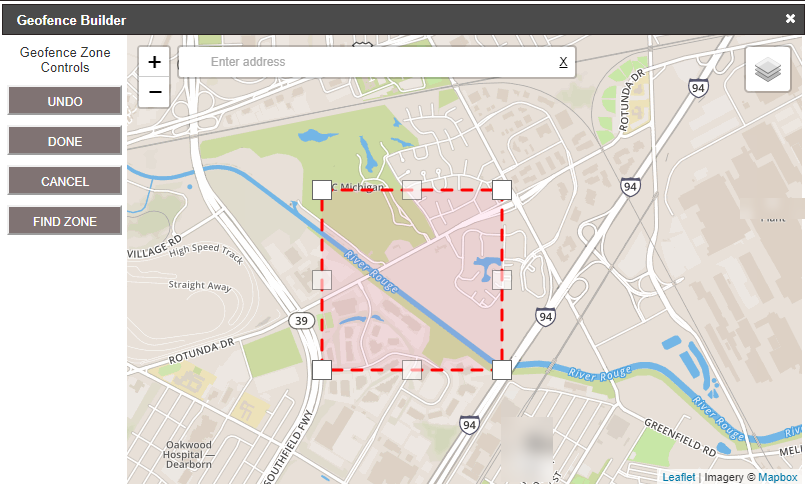
- Click the box or the points of the shaded box and drag them to your liking. As you drag the points, the geofence builder will add more points so that you can create irregular shapes.
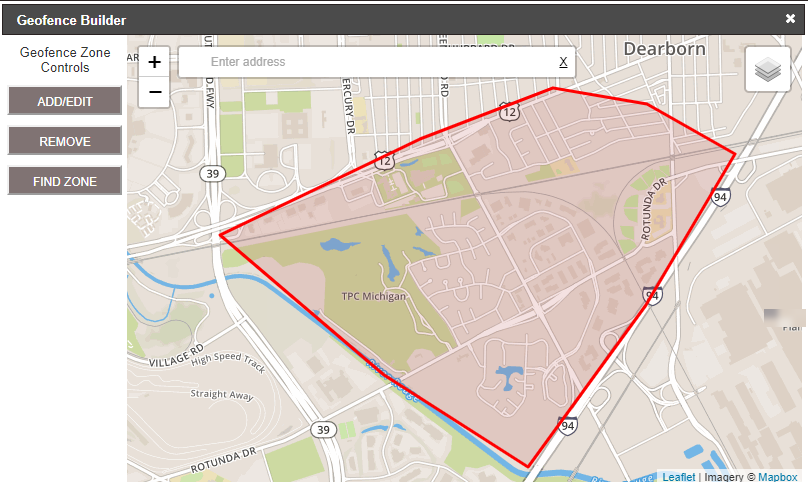
UI navigation tips:
- The map view icon in the upper right corner of the map will switch between a street view and a satellite view of the map.
- You can use the plus and minus icons or the mouse wheel to zoom in or out.
-
When you are satisfied with the shape of your geofence area, click Done.
-
Type a name for your geofence in the Zone Name box. If you like, you can also enter a description.
You will not be able to save your geofence unless you give it a name. The description field is optional.
- Click Save and Exit. (If you simply click Exit the geofence builder will close without saving your geofence zone.)
You should now see the name of your geofence in the Geofence Filtering box. (The one in the screenshot below is named Test.)
- Select your other geofence settings, as described below.
Rule
This defines whether to include or exclude the data within your geofence.
From the drop-down list select Include data INSIDE the zone, include data OUTSIDE the zone, Include data ENTERING the zone, or Include data exiting the zone.
GPS Signals
If you select Default, DATALAB will attempt to obtain GPS data from the default parameters. If the GPS data for your files is in a different parameter, you should select Custom and then enter the parameter names for latitude and longitude in the appropriate boxes.
Missing GPS Signal Rule
Sometimes a vehicle loses GPS signal for a period of time (if it goes through a tunnel, for example). This setting allows you to include or exclude any data with missing GPS signals from your analysis.
Green Plus Icon
If you want to add another geofence to your experiment, click the green plus button below the settings box. If you add multiple geofence filters, DATALAB treat them as an OR; in other words, data will be included if it meets any of the geofence criteria.