Analytics tools (legacy)
This page documents the legacy Qualifier interface. Unless a task is only available there, the User Guide covers the interface you see when you sign in.
To reach the legacy interface, set the Next-Gen UI toggle in the top bar to Off.
Three legacy analysis pages appear under Analytics tools in the main left navigation:
- Analytics
- Snapshots
- Reports
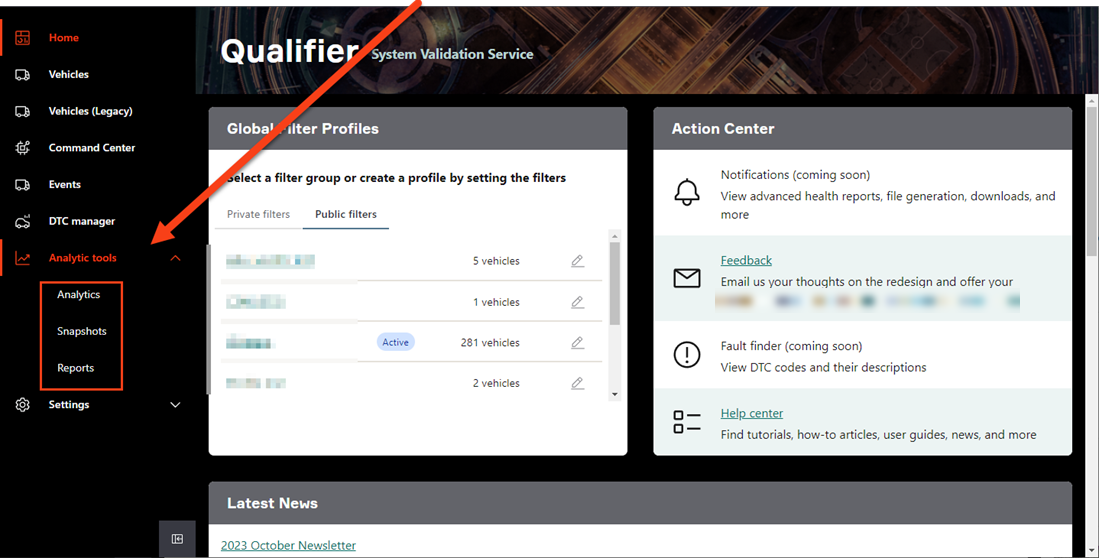
You enter these sections from the standard navigation, but the pages themselves use the legacy interface.
Analytics page overview
Analytics is optional, so it may not be enabled for your organization.
If it is available for you, you will see the Analytics page in the Analytics tools submenu.
The page contains reports created for your organization. Its contents therefore depend on the programs and reports configured for your team.
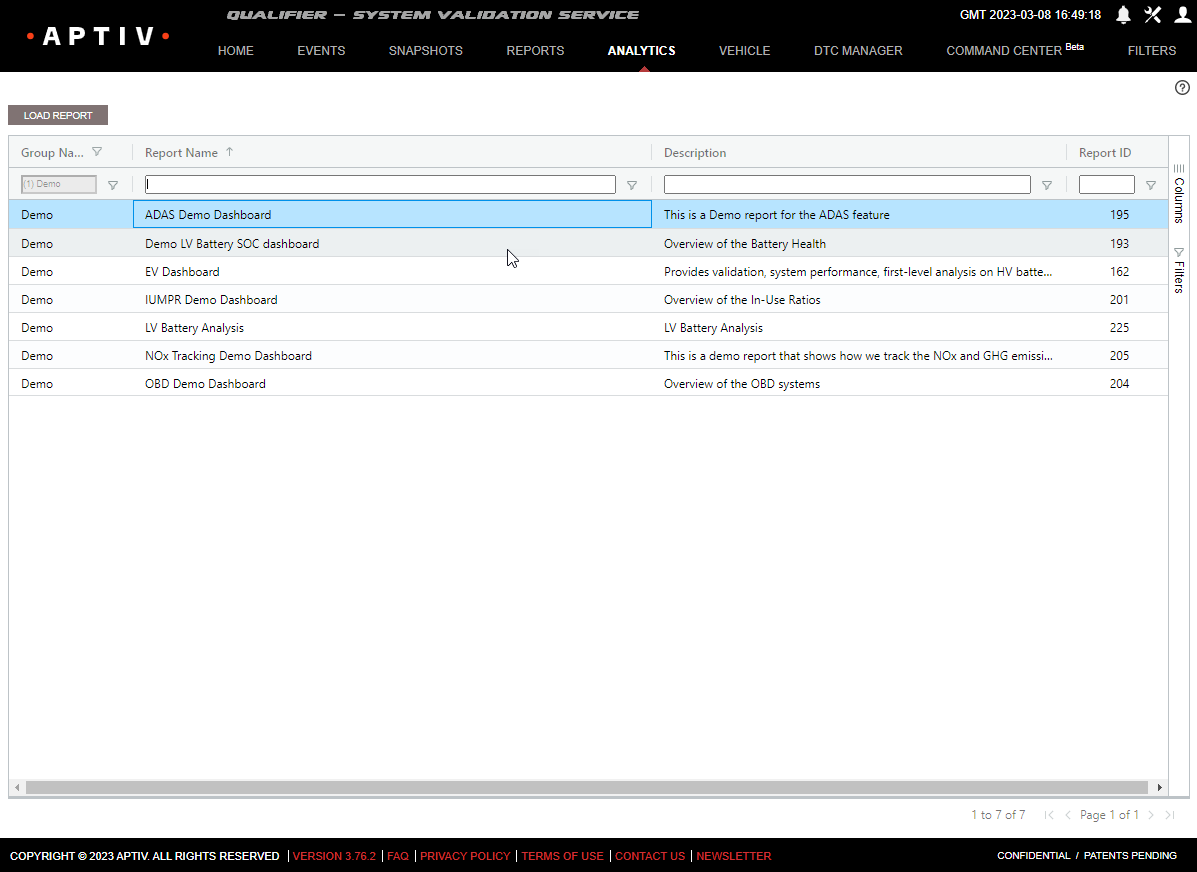
To open a report, click its name and then click Load Report.
If your organization has a lot of reports, the list may continue on multiple pages. You can move between pages using the controls in the lower right corner of the window. You can also sort search or filter the list using the controls under the column headers.
The individual reports on the Analytics page are all unique, so the features available vary greatly. In general, they are highly interactive. Clicking different areas of the charts and graphs allows you to drill down into the details of your data. Below is an example of a report that tracks key performance indicators (KPIs) for electric vehicles.
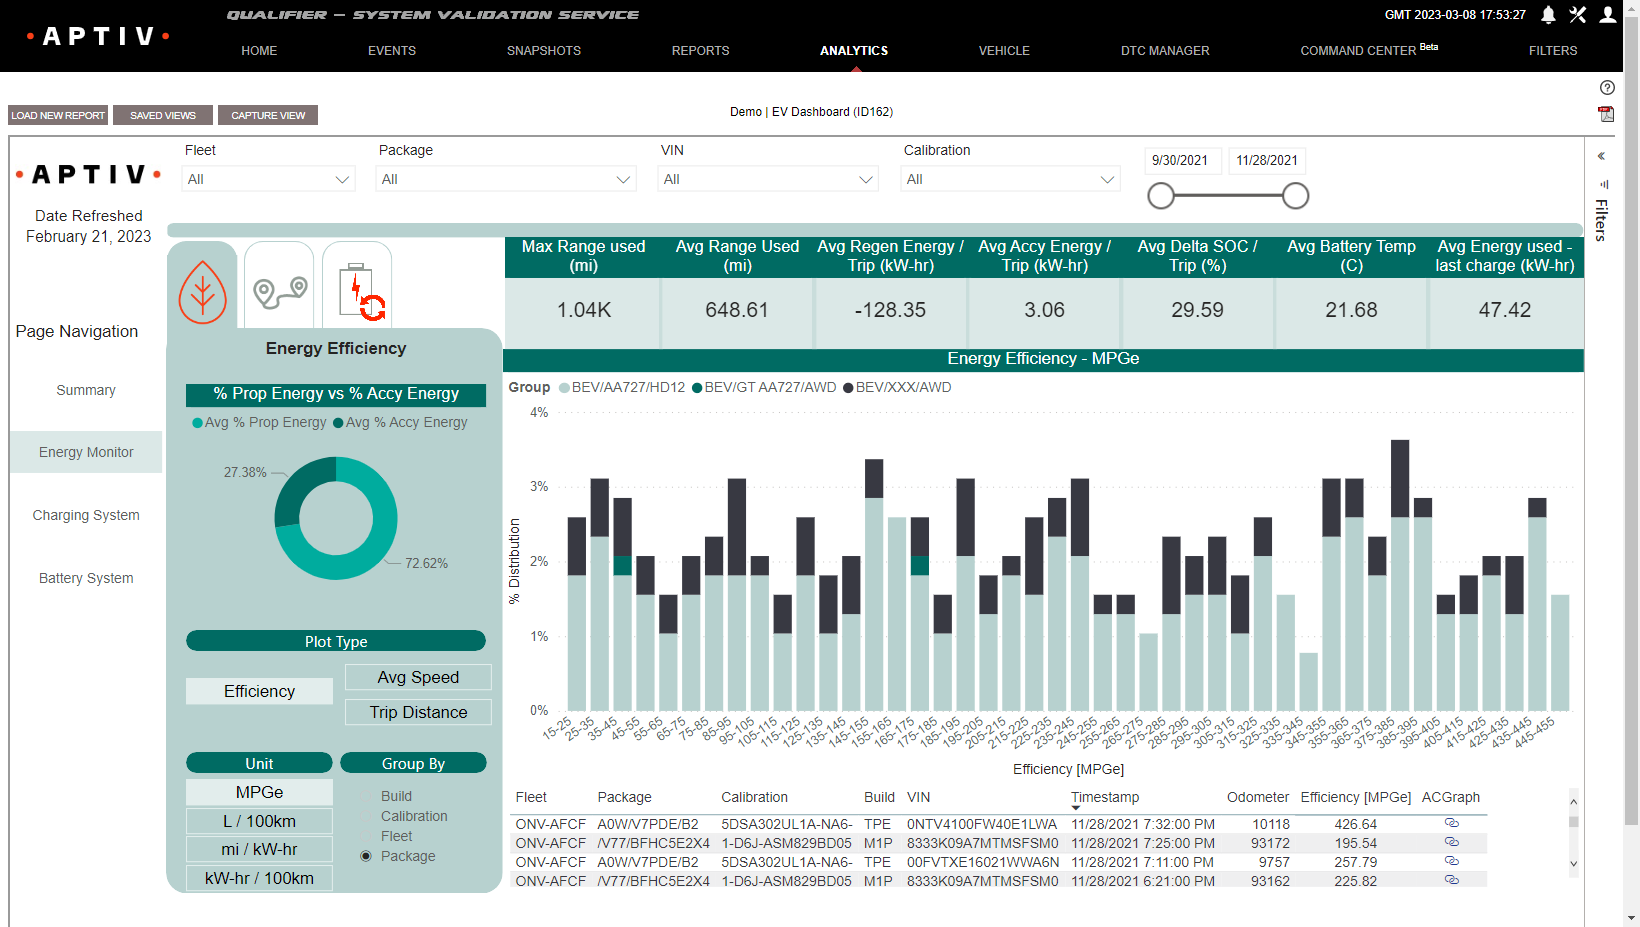
Every Analytics report has a few features in common:
- To return to the list of reports, click Load New Report in the upper left corner.
- To save the current status of your report, including any applied filters, click Capture View in the upper left corner.
- To return to a view you saved previously, click Saved Views in the upper left corner.
- To download your report as a PDF, click the PDF icon in the upper right corner.
Snapshots page overview
The Snapshots page is reached from the Analytics tools submenu in the primary left navigation.
Reports page overview
The Reports page is one of the most customizable sections of Qualifier. Your company has probably pre-configured a number of different reports that meet your organization's unique needs.
As a result, the actual interface you see when you visit the Reports page may be quite a bit different than the examples below.
The goal for this section is to explain some of the key features of the interface and the different types of reports that are available.
TMPReport categories
When you first click the Reports tab, you will see a page that looks something like this:
Before you can do anything else on the Reports page, you need to choose a report category. Here are the options:
- Status reports help track fleet activity and monitor issues. They combine vehicle usage with statistical issue analysis to summarize program performance. The Advanced Health Report, covered later on this page, belongs to this category.
- Scorecard reports provide quality metrics. They show statistical information for a subsystem's data. Most display data on a VIN-by-VIN basis, although some do have group statistic options.
- Snapshot reports help you review subsystem robustness in detail. Some contain scatter plots and statistical data, similar to what you see on the Snapshots page. Others allow you to view histogram data.
- Health reports show you the total health of a subsystem. The goal is to gather all information for a subsystem into one comprehensive report. The first section shows events and DTCs. The next section focuses on subsystem robustness with scatter plots, histograms, and statistical analysis.
TMPChoosing a report
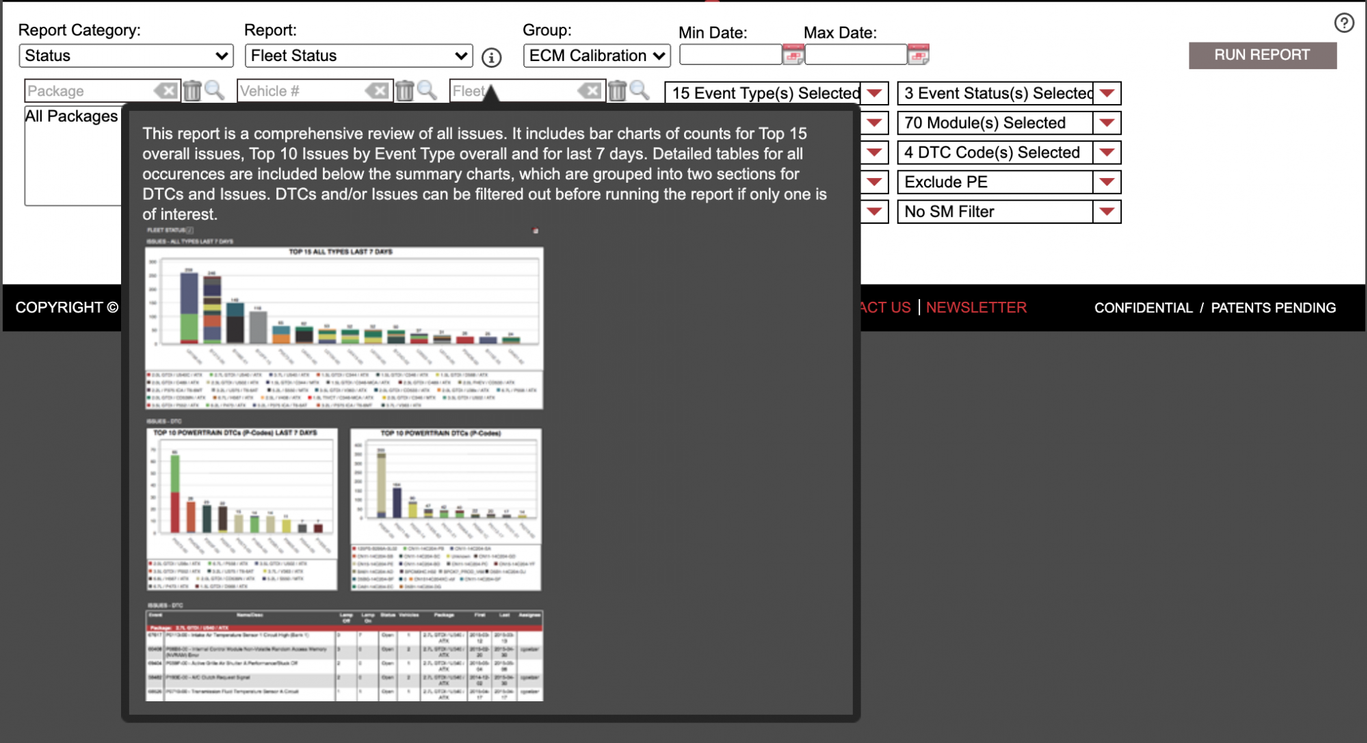
After you have selected a report category, you will need to choose a report. The actual options you see will depend on the reports your organization has set up. However, you can see information about any report by hovering over the information icon next to the Report drop-down.
Some Qualifier customers have so many custom reports available that they need a third drop-down labeled Report Sub-category. If this is the case for you, you will need to pick a sub-category before you pick a report.
TMPReport filters
After you have selected the type of report you want to run, Qualifier will bring up some controls that allow you to filter the data and configure your report. These controls will differ depending on which type of report you are running. Most of these are fairly easy to figure out, but a couple of things are worth noting:
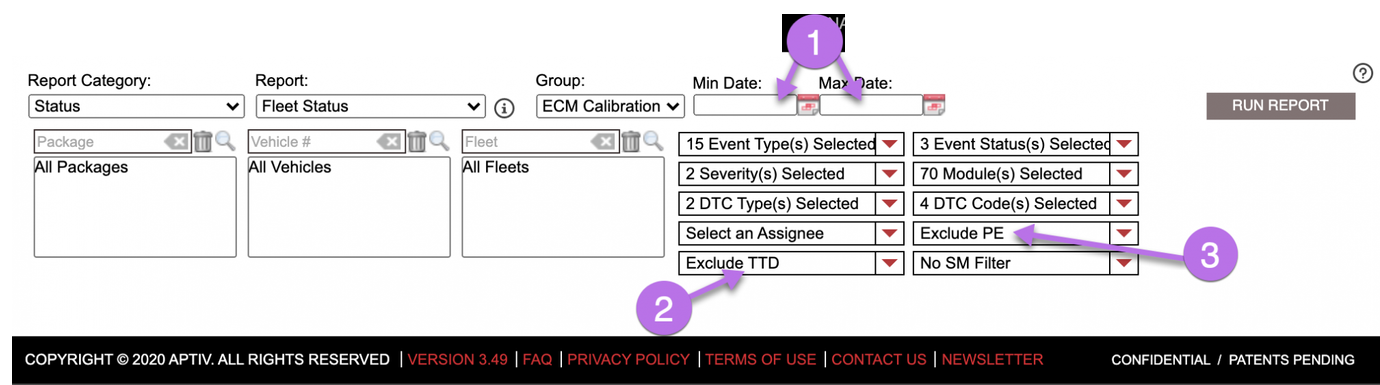
- You should always filter your report by a date range, and you should make that date range as short as possible while still meeting your needs. The longer the date range, the more data Qualifier will need to process. And the more data Qualifier needs to process, the longer it will take to display your report. In some cases, a really large report can bog down the system and make it unresponsive.
- You may see an option to Exclude TTD. TTD stands for test tool detected. The Exclude TTD option allows you to filter out DTCs that occurred while another tool (in addition to the Aptiv VDR) was plugged into the vehicle. This can be helpful because test tools can sometimes generate DTCs that don't indicate a real issue. Note that you also have the options to not filter out the TTD data or to view only the TTD data.
- You may also see an option to Exclude PE. PE stands for pre-existing. The Exclude PE option allows you to filter out DTCs that were pre-existing before the VDR started collecting trip data. This allows you to ignore codes that weren't cleared previously and do not indicate a new issue. As with the Exclude TTD option, you can also choose to not filter out the PE data or to view only the PE data.
TMPRunning a report
After you have selected your filters and other options, click Run Report. The charts and/or data tables that are part of the report will appear below the filter boxes. Some reports will also give you the option to download an Excel file or a PDF.