Use Plotly graphs in Snapshots
Snapshots uses Plotly for scatterplots, histograms, and line charts. This article collects the interactions and settings you are most likely to need while exploring those charts.
The basics
- Hover over a data point to see its detail.
- Click and drag across an area to zoom into it.
- Double-click the chart, not the axes, to zoom back out.
- Use the drop-down to switch between a scatterplot, a histogram, and a line chart.
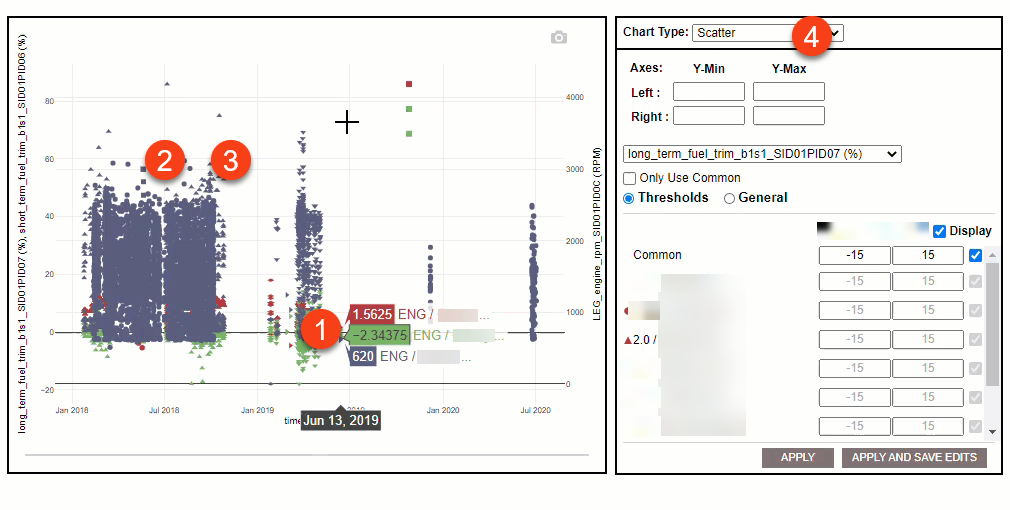
Scatterplots and line charts
The controls sit in the left panel.
Axes
- Set Y-Min and Y-Max for the vertical axis.
- Where a chart has both a left and a right vertical axis, each takes its own minimum and maximum.
- The horizontal axis cannot be given a minimum or maximum.
Thresholds and general settings
- The drop-down picks which parameter you are editing.
- Only Use Common applies the default common settings to that parameter.
- The Thresholds and General radio buttons switch between threshold settings and statistical settings.
- The section below them holds the settings themselves.
- Click Apply to see your changes on the chart.
- Click Apply and Save Edits to see them and keep them in the template.
Histograms
- The drop-down picks the parameter. A histogram shows one parameter at a time.
- Bin Definition decides whether bin size is worked out for you or set by you. Choosing CUSTOM means entering a number in Bin Count, clicking SET, filling in a y value for each bin, then clicking APPLY.
- View switches the bins between a count of values and a percentage.
- Cumulative % turns the cumulative percentage line on and off.