Manage the x and y axes in AC-Graph
Every AC-Graph plot uses time in seconds on the horizontal axis and numeric values on the vertical axis. The controls in this article change the visible time range and make parameters with different scales easier to compare.
If you need to plot one parameter against another rather than against time, use Snapshots.
The x axis
The x axis is fixed to seconds; it cannot be changed to minutes or hours. Zoom to show a longer or shorter interval.
Every graph starts at 0, with one exception covered below.
When you add a parameter, the x axis fits the full length of the file.
The controls
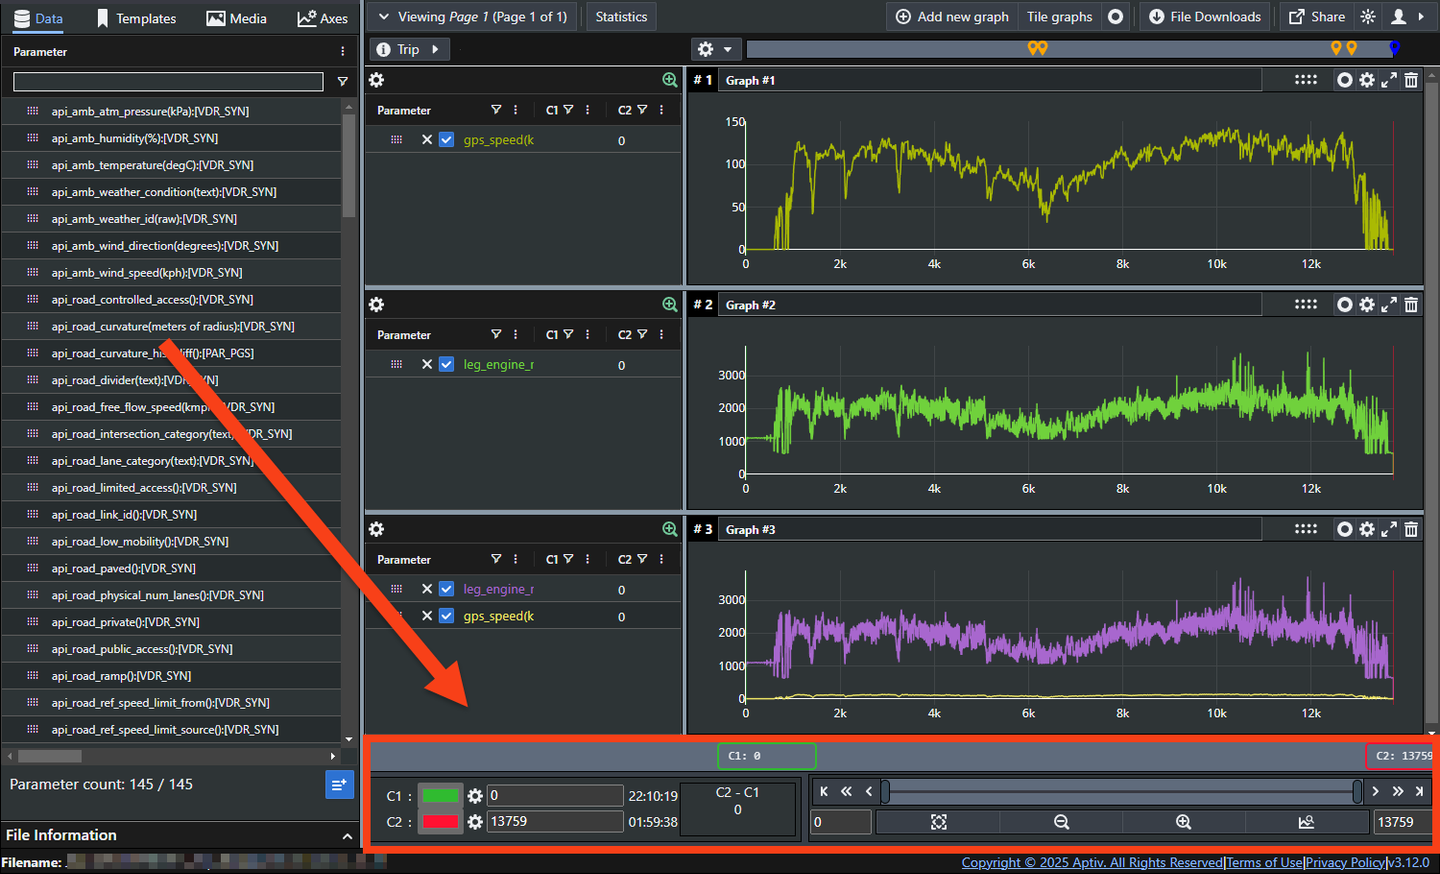
The x axis controls sit below the graphs.
Zoom
The slider is the quickest way to change the view. Drag either end to move the start or the end of the visible range, or drag the middle to move the window along.
For finer control, use the buttons at either end of the slider, or type exact values into the input boxes.
Preset zoom buttons
| Button | What it does |
|---|---|
| Fit | Zooms to the full extent of the file |
| Out | Zooms out by 25 percent |
| In | Zooms in by 25 percent |
| Markers | Zooms to the range between the C1 and C2 markers |
C1 and C2 markers
C1 and C2 mark out an interval on the graph. C1 starts at the lowest x value in the file, usually 0, and C2 at the highest.
Type exact values into the input boxes to place them, and click the colored bars beside the gear icons to change their colors. Click the zoom-to-markers button to fit the graphs to the interval between them.
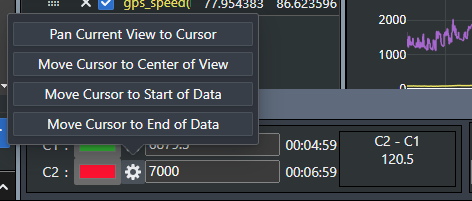
The gear icons also offer predefined intervals.
Multifiles aligned by trigger
There is one case where the x axis goes negative. In multi-file mode, if you align files by trigger, 0 is the moment of the trigger and anything before it is negative time.
The y axis
The y axis is numeric but unitless. This lets parameters measured in different units appear on the same graph, but it also means you must read their names to interpret the scale correctly.
In the graph below, wind speed and humidity are plotted together.

The unit is usually in the parameter name, in brackets. Humidity above appears as
api_amb_humidity(%):[VDR_SYN], so it is a percentage.
A trace moving between 20 and 30 does not reveal whether the unit is miles per hour or kilometers per hour. Confirm the unit in the parameter name before interpreting the values.
Autoscaling
By default the y axis fits the full range of every parameter on the graph, and rescales as you add or remove them.
In the example below, the axis goes from a maximum of 35 up to 80 when humidity is added, and back to 35 when it is removed.
Why comparing two parameters on one graph can go wrong
If you want to compare two values over the same period, the simplest approach is one parameter per graph, stacked. They share the time axis, so they line up.
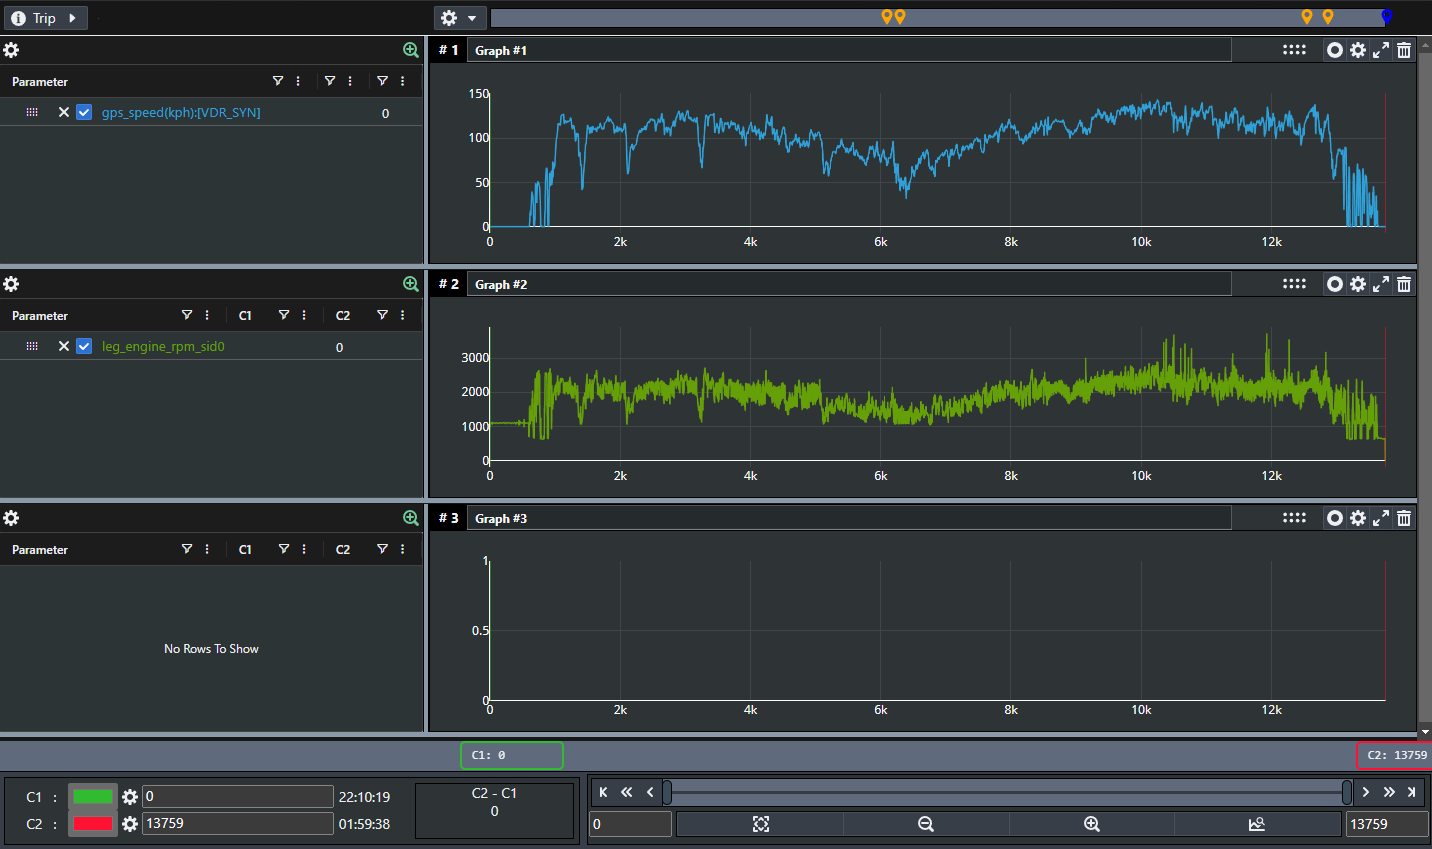
Put those same two on one graph and the comparison falls apart. Because the axis scales to the largest value present, the speed parameter flattens into a line barely above zero.
That is what the Axes tab is for.
Give a parameter its own axis
The Axes tab is in the top left, beside Data, Templates, and Media.
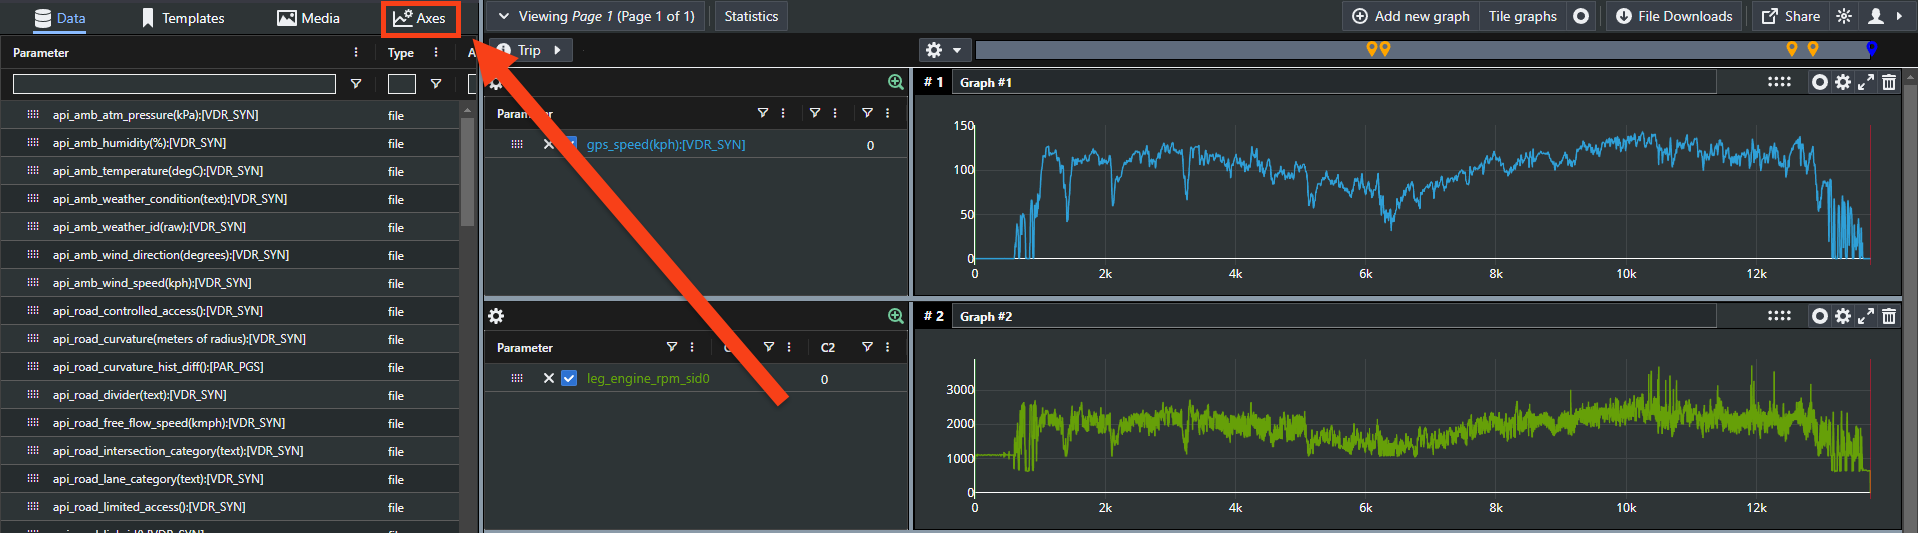
Giving each parameter its own axis lets both keep a usable shape on the same graph.
Only one axis is visible at a time. Click a parameter name to show its axis, which hides the others.
To set one up:
- Add the parameters you want to a graph.
- Click the Axes tab.
- Click Add.
- Enter an axis name. The parameter's units make a good name.
- Either select Autoscale, or enter your own minimum and maximum.
- Click Save.
- Drag the parameter from your graph into the Parameters using Axis section.
- Click Save.
From then on, that parameter uses those axis settings everywhere, until you change or delete them in the Axes tab.
Axis settings can be saved and shared as part of a template.