Create thresholds in AC-Graph
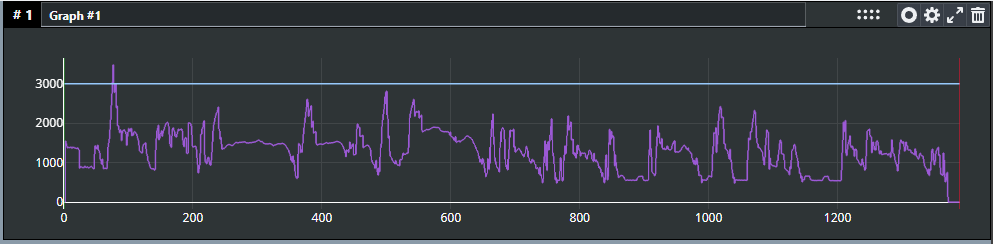
Add a threshold to mark a significant y value with a horizontal line. It gives you a consistent visual reference for spotting where plotted data crosses a limit.
Thresholds work in both single-file and multi-file mode.
Thresholds have no units
A threshold is a plain numeric constant. It is not tied to miles per hour, kilometers per hour, degrees, or anything else.
Because the y axis scales to the plotted parameters, a
threshold at 95 sits at 95 on that axis, and whether that means 95 km/h or
95 mph depends entirely on the parameter that set the scale. Check the parameter
before you read anything into where the line falls.
Create one
-
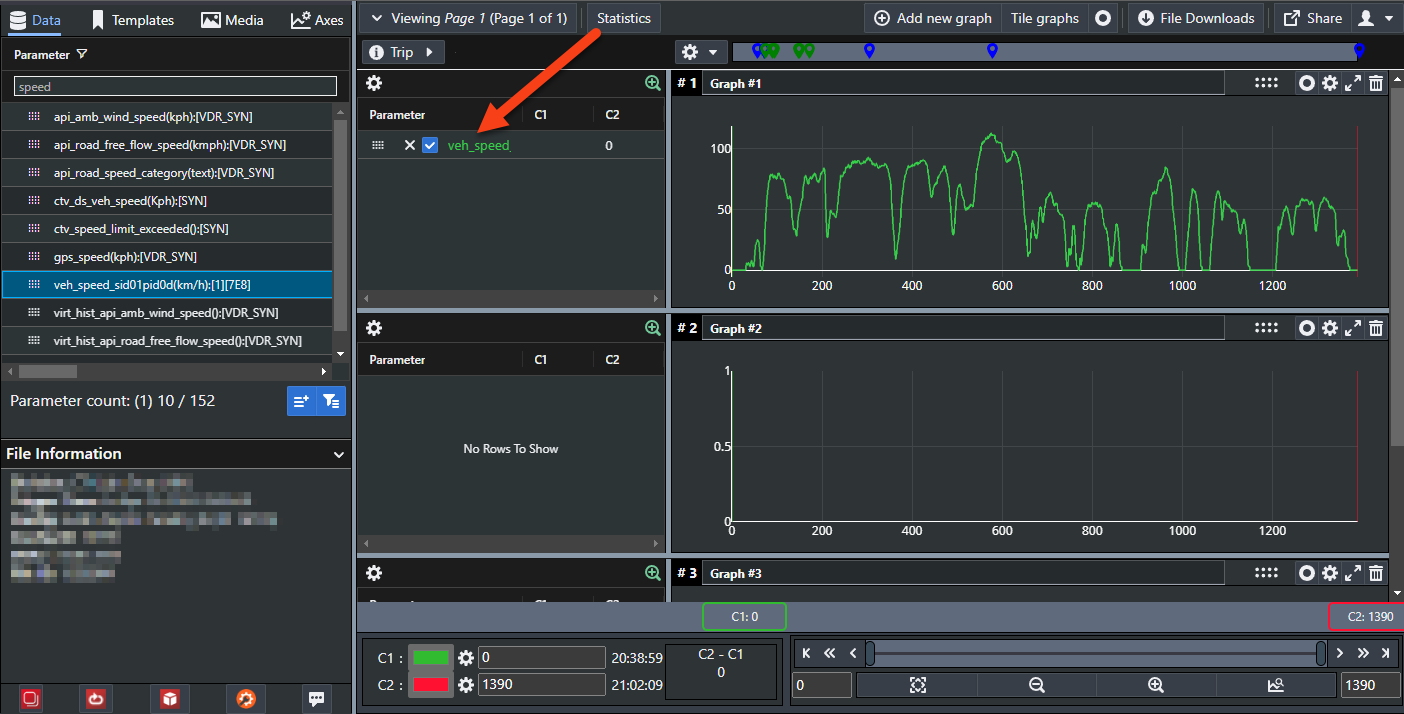
Add the parameters you care about to a graph.
-
Click the blue Custom ACG Parameter icon below the parameter list.
-
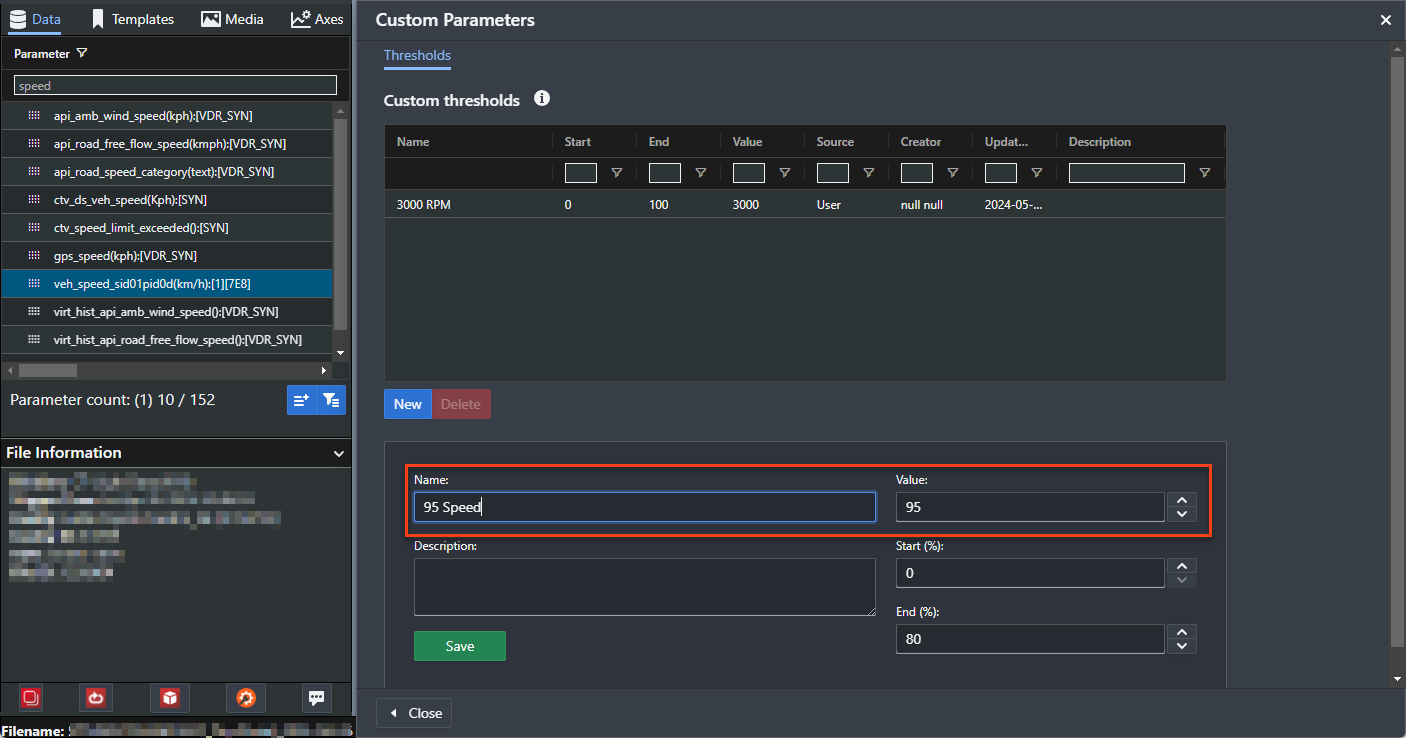
Enter a name and a value. The value is the y position of the line. You can also add a description, and a start and end point expressed as a percentage of the graph width.
-
Click Save, then Close to go back to the main AC-Graph screen.
-
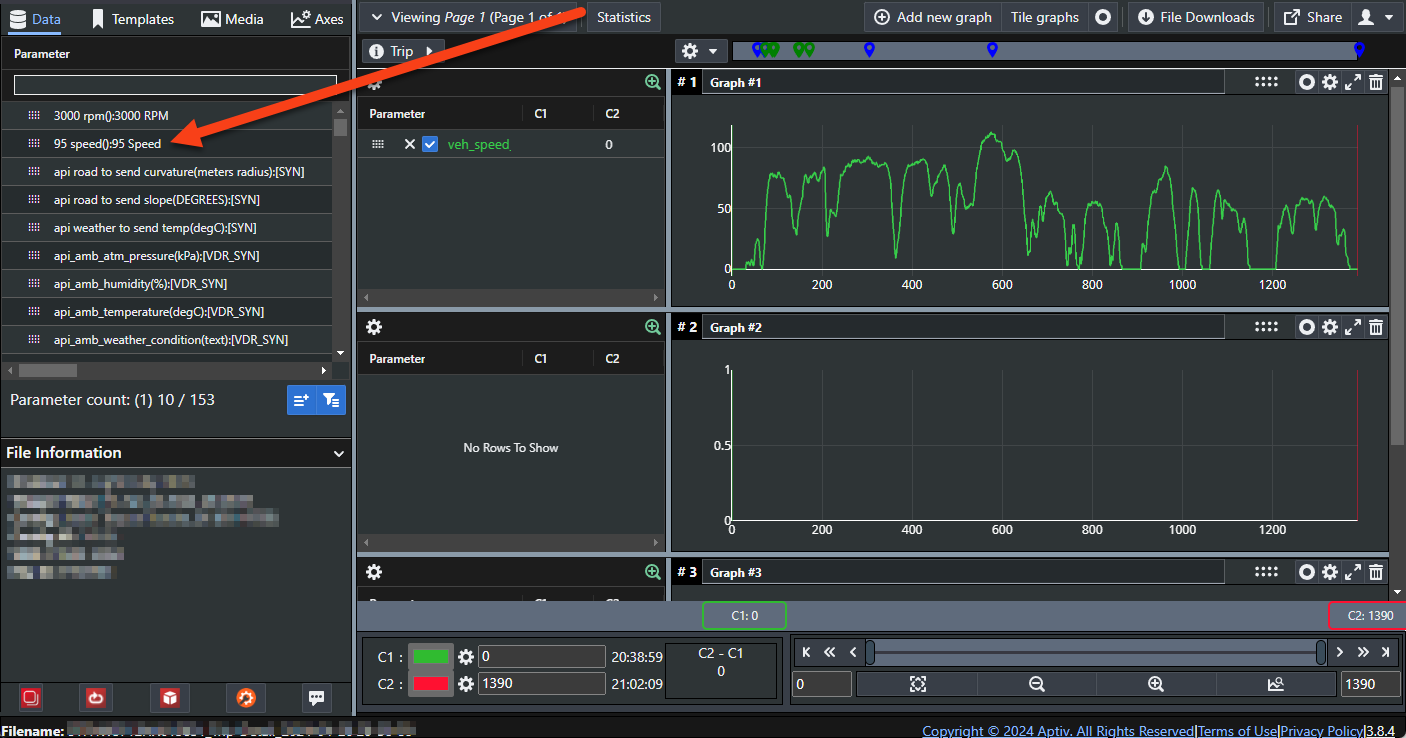
Search for your threshold in the parameter list on the Data tab. It sorts near the top.
-
Drag it onto the graph you want it on.
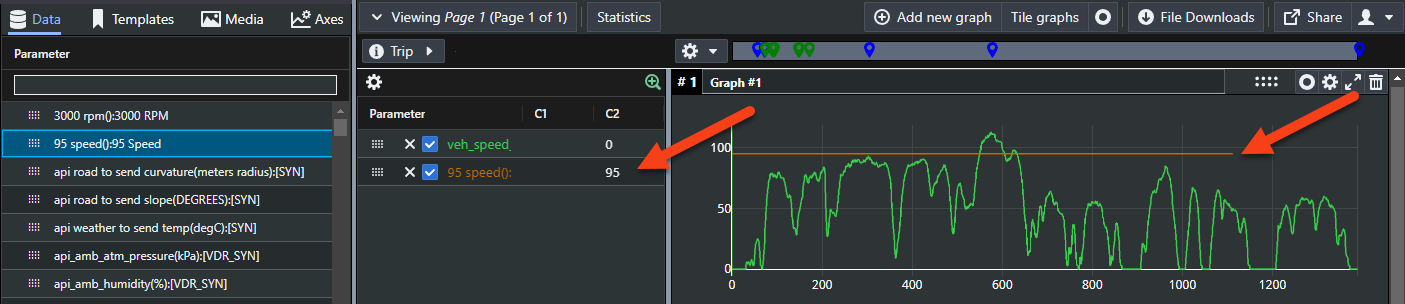
The threshold appears as a horizontal line. In this example, its configured end position stops the line at 80 percent of the graph width.