Create a basic graph in AC-Graph
Plot one or more parameters to see how their values changed over the course of a recording. This basic workflow is also the starting point for thresholds, custom axes, and reusable templates.
-
Sign in to Qualifier.
-
Open AC-Graph by clicking the AC-Graph icon anywhere it appears on the Vehicles, Events, or DTC Manager page.
Depending on how your organization is set up, you may be asked to sign in again through your own single sign-on.
-
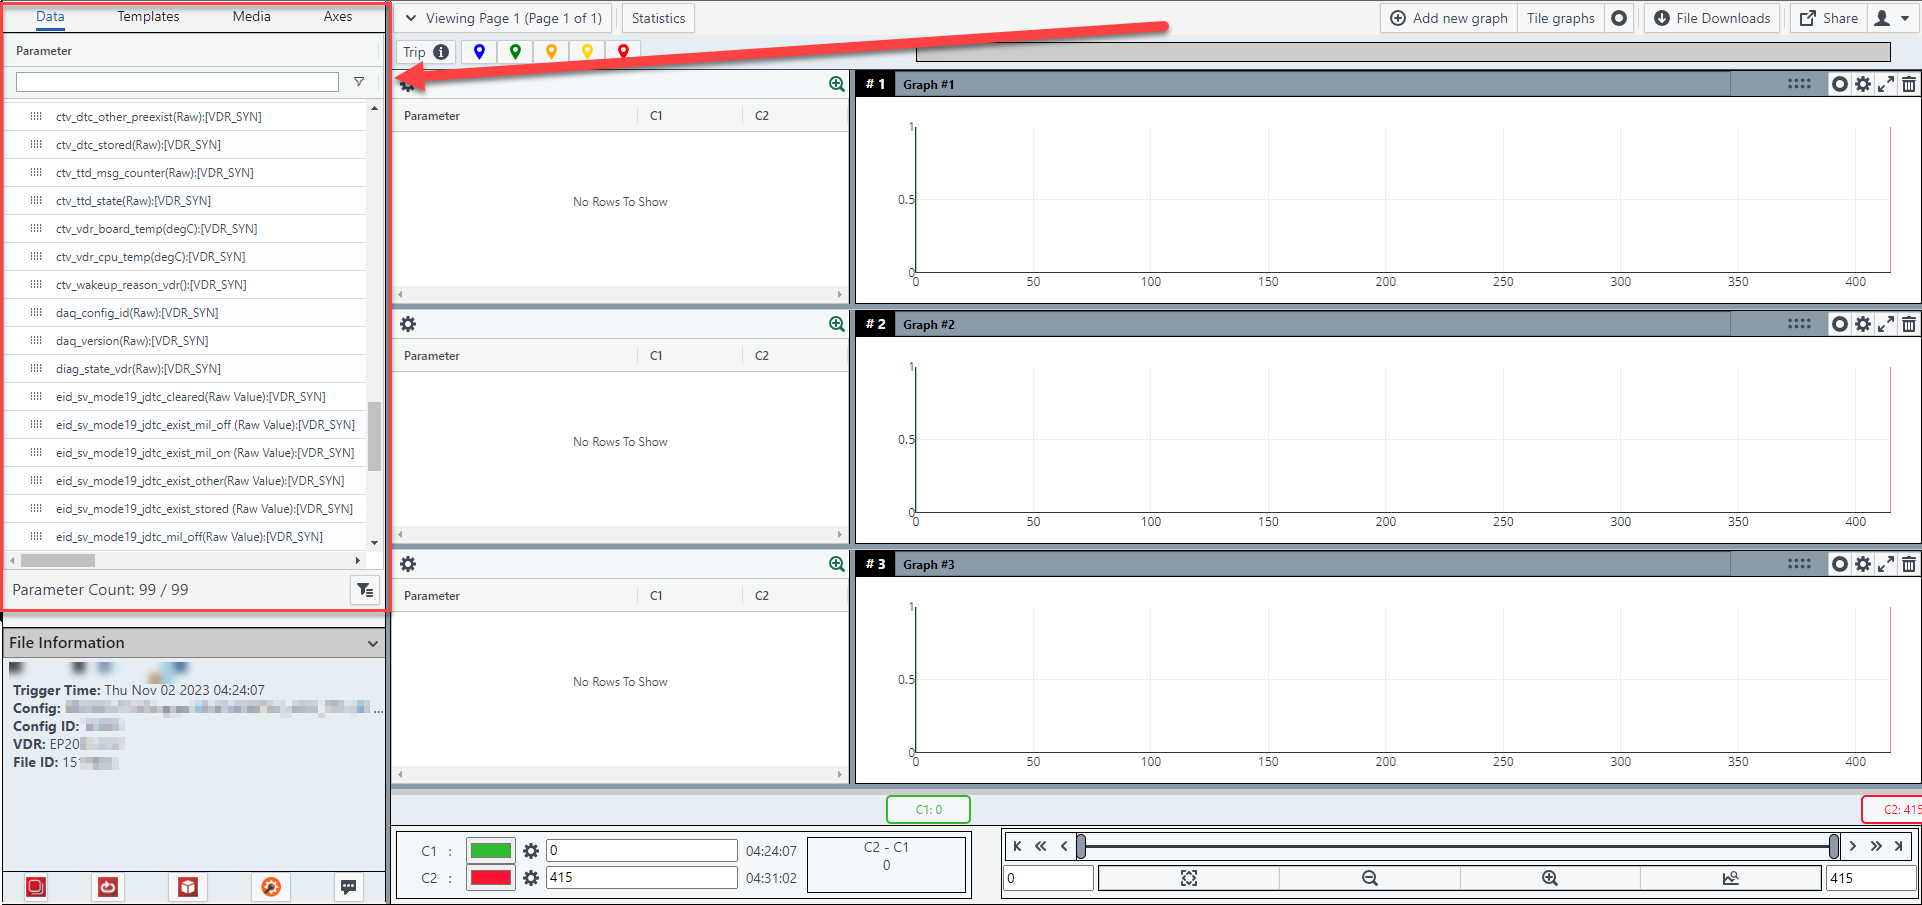
Find the parameters you want.
Most vehicles report hundreds of parameters. Scroll the parameter list, or type in the search box to narrow it as you type.
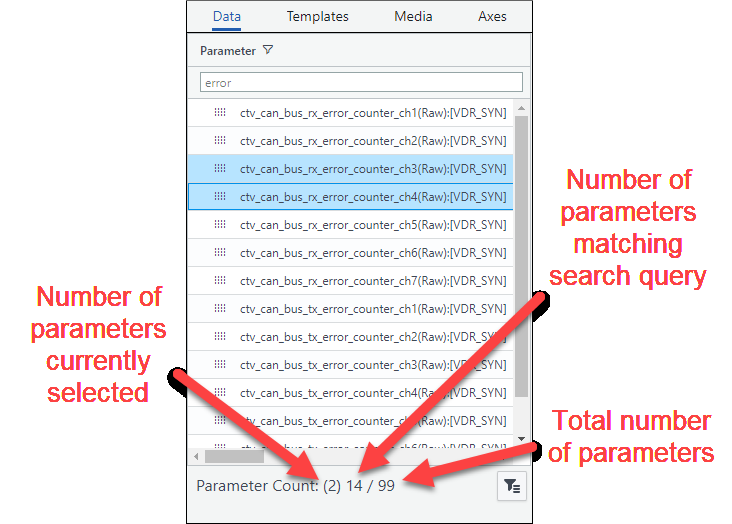
The Parameter Count below the list tells you how many parameters you are looking at. When the list is filtered, the first number is the filtered count and the second is the total. A third number in parentheses appears once you start selecting, showing how many you have picked.
-
Drag each parameter onto one of the graph windows. Use the six-dot handle beside the parameter name.
AC-Graph plots the data as soon as you drop the parameter onto a graph window.